
The Ethereum price has recovered half the losses it suffered on Tuesday, but the bounce looks similar to the one following May’s collapse. Although the way crypto’s bounced back from the onslaught earlier this week is commendable, it doesn’t guarantee a one-way trip back to last week’s highs. In fact, despite being on a smaller scale, so far, the Ethereum price action is playing out the same way it did before the second bout of liquidation on May 21st.
Similarities Between May and Now
On May 19th, Ethereum (ETH/USD) suffered its biggest-ever one-day loss, sliding 47% before bouncing to finish the session lower by 28%. The following day, the recovery continued with a 14% rally. However, on the 21st, when the bulls were starting to get comfortable, ETH embarked on a three-day slide that wiped 40% from its value and ushered in two months of misery.
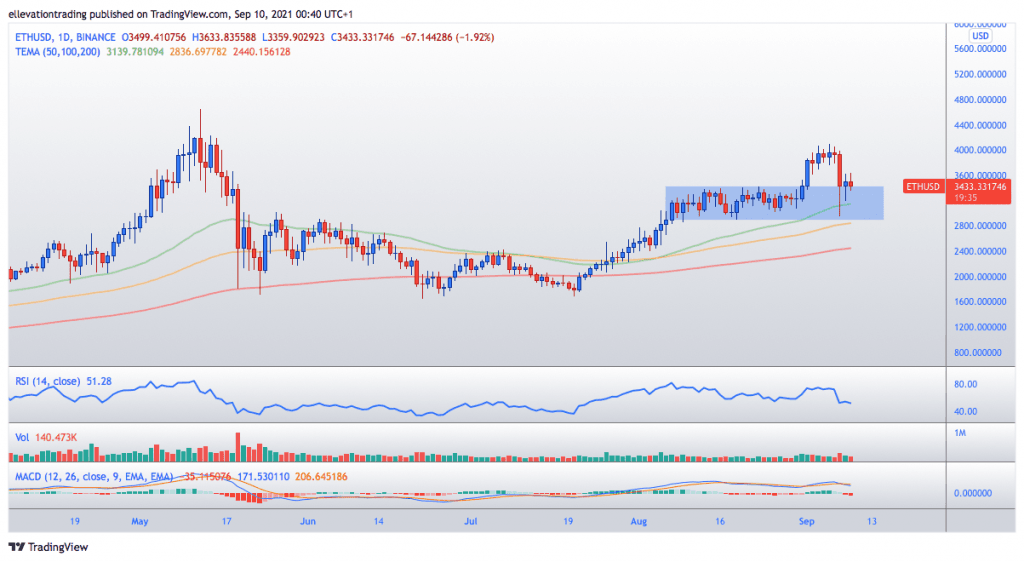
September 7th, ETH dropped 25% intraday before rebounding into the close to pare the loss to 13.7%. On Wednesday, the recovery continued, and Ethereum improved by 6%. However, yesterday, the price tracked back to the previous days opening price.
But what’s interesting is that if we scroll back to May’s drop, we see a similar pattern emerging. The closing price on the 21st was the same as the 19ths. Furthermore, the highs of the 20th and 21st are within $50 of each other.
Thursday’s closing price of $3,424 is almost a perfect match with Tuesday’s $3,433 close. Not to mention that the highs from Wednesday and yesterday are within $20 of each other. So far, the analog is near on exact.
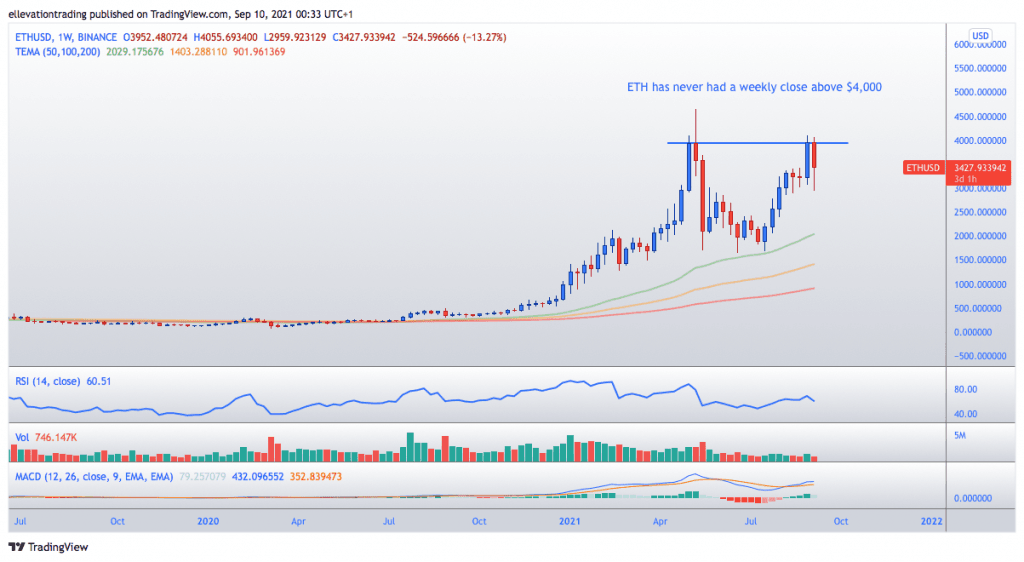
Now here is where it gets weirder. Turning to the weekly chart, more similarities are evident. In the first week of May, the Ethereum price jumped 33% to a new all-time high of $4,085 before finishing the week at $3,928. The following week, ETH advanced to a new $4,646 before reversing 22% to close the weekly candle at $3,585. The week after, the price halved.
In the first week of September, the Ethereum Price gained 28% to $4,087 ($2 above the first weekly close of May) and settled at $3,952, just $24 above the same week in May.
Until this weekly candle is completed, we won’t know for sure if the redux will remain intact. But if it does, it’s worth noting what happened in the third week of May. Of course, it’s too early to suggest the price will collapse in the next few days. But it’s also too early to assume that ETH will continue higher. As mark twain said, “History never repeats, but it does often rhyme.”
Ethereum Price Chart (Daily)
Ethereum Chart (Weekly)
For more market insights, follow Elliott on Twitter.