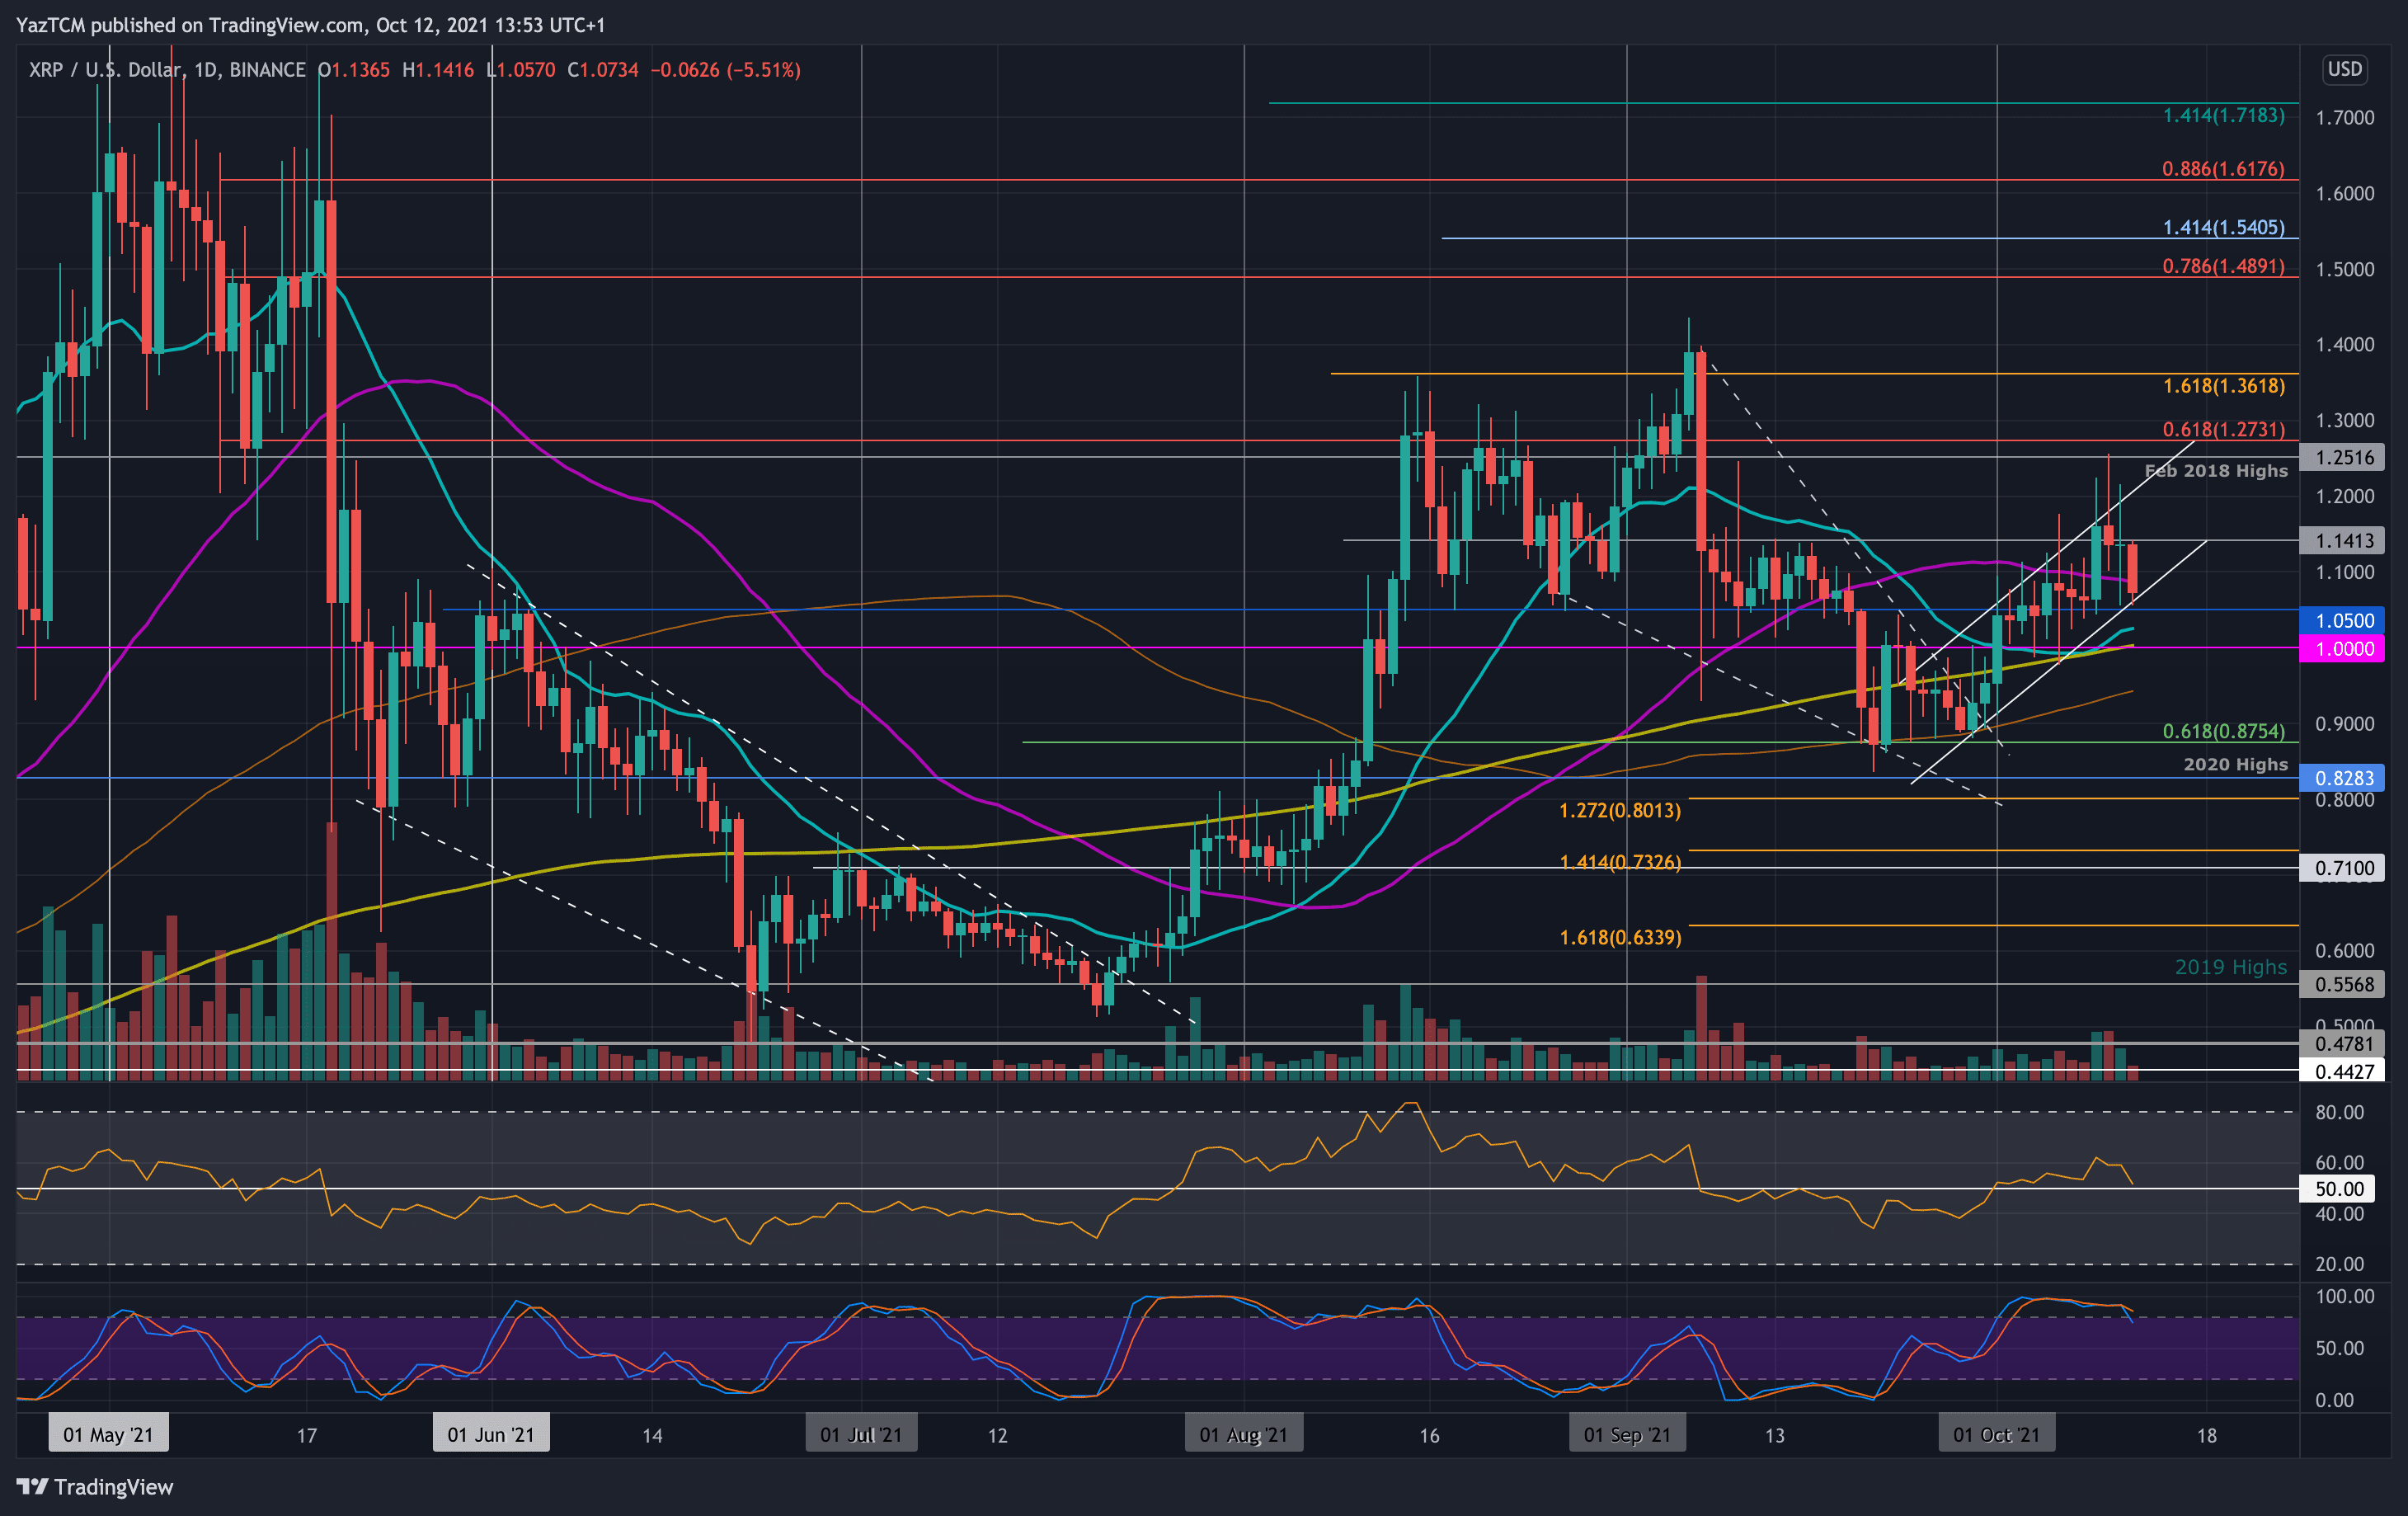
XRP/USD – XRP Falls Into Price Channel Support.
Key Support Levels: $1.05, $1.00, $0.95.
Key Resistance Levels: $1.10, $1.20, $1.25.
XRP found support at $0.875 (.618 Fib & 50-day MA) toward the end of September and ended up rebounding from there. After this, XRP started to form a short-term ascending price channel in October, which allowed it to break the 50-day MA at $1.10 and reach as high as $1.25 (Feb 2018 highs).
Unfortunately, the bulls were unable to close above the upper angle of the price channel and rolled over from there on Sunday. Today, XRP fell from $1.15 to break beneath the 50-day MA and find support at the lower angle of the price channel.
XRP-USD Short Term Price Prediction
Looking ahead, the first resistance lies at $1.10 (50-day MA). This is followed by $1.20 (upper angle of the price channel), $1.25 (Feb 2018 highs), and $1.30.
On the other side, if the bears fall beneath the price channel, the first support lies at $1.05. This is followed by $1.00 (200-day MA), $0.95 (100-day MA), and $0.875 (.618 Fib).
The daily RSI is back at the midline, indicating indecision within the market. To remain inside the price channel, XRP would need to rebound from the midline to prevent bearish momentum from entering the market.
XRP/BTC – XRP Falls Beneath 2000 SAT Support
Key Support Levels: 1860 SAT, 1800 SAT, 1735 SAT.
Key Resistance Levels: 1940 SAT, 2000 SAT, 2100 SAT.
Like most altcoins, XRP is suffering heavily against BTC. The coin rolled over at 2700 SAT at the start of September and has since dropped by a total of 30% as it fell inside a descending price channel.
In October, XRP first established support at 1940 SAT. However, XRP fell beneath this support today to reach 1900 SAT. It still remains inside the falling price channel.
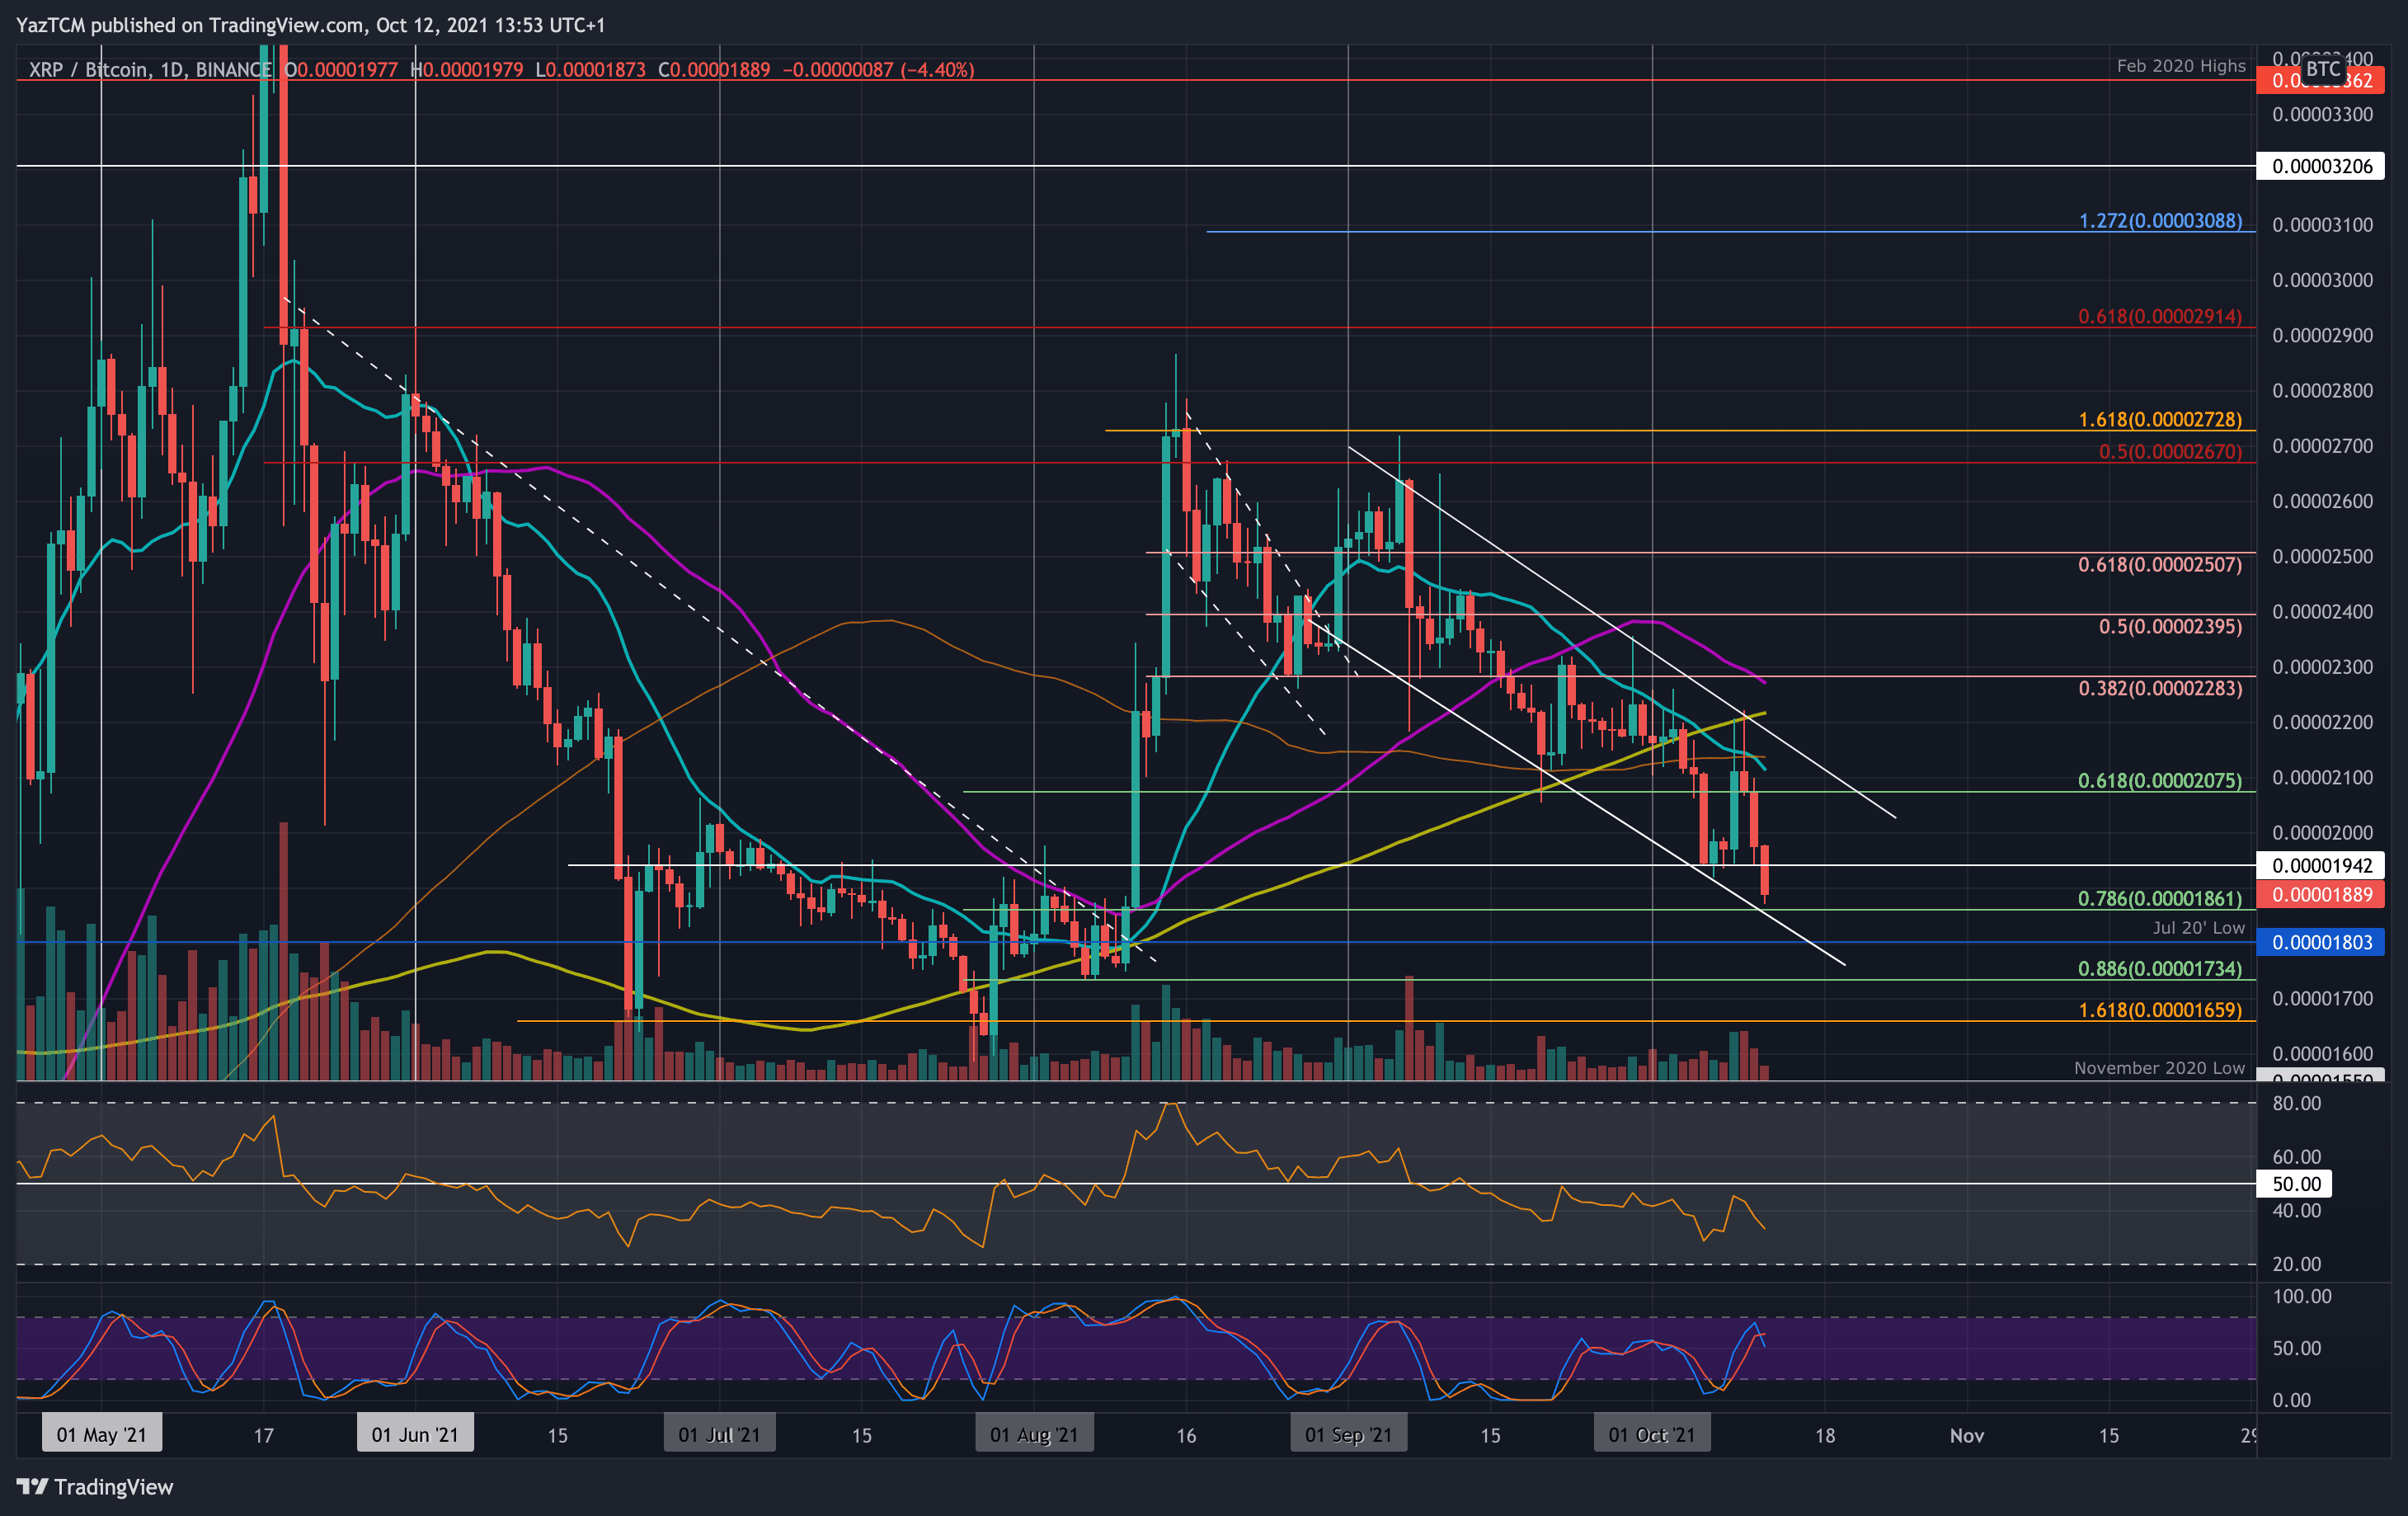
XRP-BTC Short Term Price Prediction
Looking ahead, the first support lies at 1860 SAT (.786 Fib). This is followed by the lower angle of the price channel, 1800 SAT (July 20 lows), and 1735 SAT (.886 Fib).
On the other side, the first resistance lies at 1940 SAT. This is followed by 2000 SAT, 2100 SAT (20-day MA0, and 2150 SAT (upper angle of the price channel).
The daily RSI remains beneath the midline, showing the bears are in total control over the market momentum.
Binance Futures 50 USDT FREE Voucher: Use this link to register & get 10% off fees and 50 USDT when trading 500 USDT (limited offer).
PrimeXBT Special Offer: Use this link to register & enter POTATO50 code to get 50% free bonus on any deposit up to 1 BTC.
Disclaimer: Information found on CryptoPotato is those of writers quoted. It does not represent the opinions of CryptoPotato on whether to buy, sell, or hold any investments. You are advised to conduct your own research before making any investment decisions. Use provided information at your own risk. See Disclaimer for more information.
Cryptocurrency charts by TradingView.