blackdovfx/iStock via Getty Images
Produced by Ryan Wilday with Avi Gilburt and Jason Appel
Altcoins are generally highly correlated to each other and to Bitcoin. They are often more correlated to Bitcoin than stocks are to their respective indices. Many crypto traders hope for a mature crypto market where innovative altcoin projects will stand on their own.
With stable coins now being pervasive in crypto exchanges, altcoins don’t rely on Bitcoin for liquidity as much as they used to. The increase in trading with stable coins is an important step toward the uncoupling of altcoins from Bitcoin. However, to this day, we can say that whatever direction Bitcoin goes in, so goes the rest of the crypto market.
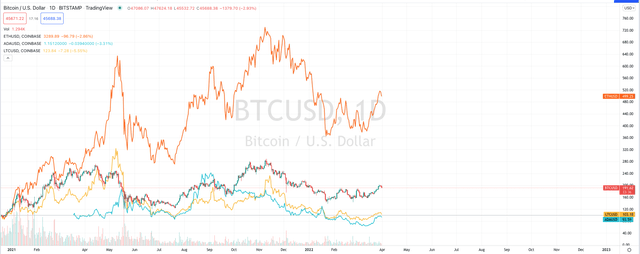
Below, I took a chart of Bitcoin and overlaid colored lines to represent Cardano (ADA-USD) in blue, Ethereum (ETH-USD) in orange, and Litecoin (LTC-USD) in yellow. As you can see, the relative peaks and troughs are in the same locations. Sometimes they differ in degree, such as Cardano’s lower high in November 2021, when Bitcoin put in a higher high. However, altcoins generally head higher when Bitcoin runs higher, and fall when Bitcoin falls.
Tradingview.com
Chart of Bitcoin compared to Ethereum, Cardano, and Litecoin
Bitcoin Slows the Show
In Bitcoin: Another Detour on the Moonpath, Jason Appel, with whom I co-host the Crypto Waves service on Seeking Alpha, discussed how sentiment among crypto investors is in the pits. I have noticed that my Twitter feed has turned into a club of traders looking for short setups in Bitcoin. Both Jason and I consider the recent action in Bitcoin to be some of the worst structure we’ve seen near an important low at any time in our crypto trading years. Nearly every fledgling rally since January low has nearly been retraced making the market look like it wants to break down. It’s no wonder that crypto traders are feeling beat up and are giving up.
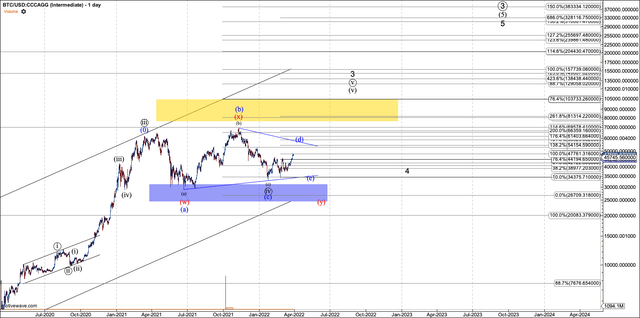
Yet we still see this price region as one of the best opportunities in Bitcoin since the March 2020 low. This bullish cycle which began in December 2018 is very mature, but is not complete. While we certainly didn’t expect the fourth wave flat that began in May 2021 to take nearly a year, such corrections often build up strong moves as sentiment turns sour.
The question is whether the bottom is in.
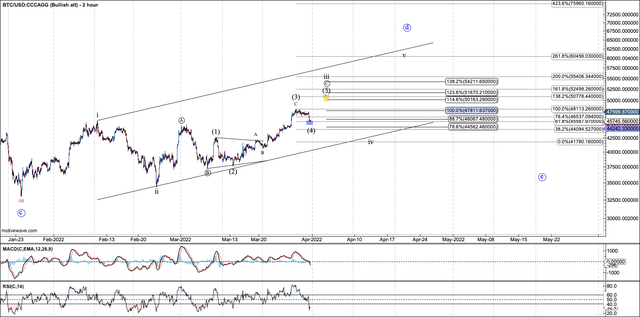
As of writing, Bitcoin is pushing toward the $50K level. We consider this to be signaling an important upside breakout. The issue with this view is that our base is not that of an impulse, but rather corrective in nature. This means we have to be cautious.
Possibly, Bitcoin is simply reversing in a diagonal, which I illustrate in black on my micro chart. The issue with diagonals is that they can’t be trusted until they complete all five waves. Another option is that, rather than a 4th wave flat, Bitcoin is finishing up a large one-year long triangle. This is shown in blue. In this view, the current reversal marking the start of the D wave should be corrective. Finally, in red, a WXY works where Bitcoin must drop in Y to the $28K region. WXYs are common in Bitcoin. However, until we break through $44,400 I will discount the red count. I simply keep the count for risk management, given our unorthodox reversal.
Motivewave software
Two-hour chart of Bitcoin
Motivewave software
Daily chart of Bitcoin
A few Nice Altcoin Setups
While Bitcoin figures itself out, we’ve had a nice rally in altcoins in the last two weeks. I want to share a few that we have followed rather closely, accumulated a little, and which show nice potential when Bitcoin moves decisively higher.
Avalanche is a smart contract platform touted as an alternative to Ethereum. It offers lower transaction fees than the older blockchain. Total value locked into smart contracts on Avalanche reportedly reached $10B last month. This is healthy growth. I use Avalanche in some of my decentralized finance (DEFI) work.
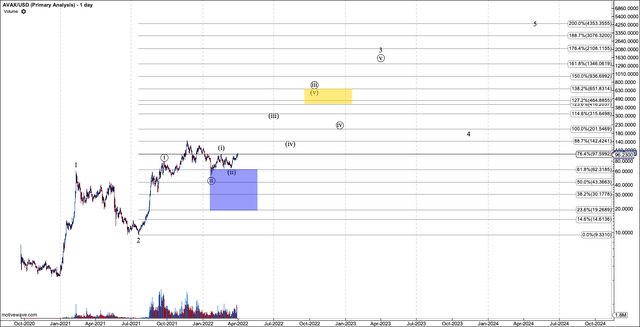
As we look into the chart for Avalanche, we have a nice setup for a move higher. Avalanche, at $92 and change as of writing, is creeping toward its all-time high at $147. We have a local setup that suggests a breakout is possible. Once over $147, the next big target is $440.
In the short term, if AVAX loses footing and drops below $65, it can drop to between $20 and $30. That’s not expected at this time, and it doesn’t change the view that AVAX can reach $440. But a break below $65 will definitely delay gratification.
My long-term chart suggests we can hit $4000 AVAX eventually. Just note that the bull market in Bitcoin is quite mature, leaving AVAX little time to make it to that target. So for now, we will trade for the more reasonable target of $440. A 4X move in altcoins is fairly normal.
Motivewave software
Daily chart of Avalanche
Solana is the next altcoin to look at, another alternative to Ethereum. I use it regularly. You may remember my review of the Solana chart in an earlier article. By and large, Solana took my primary path from that write-up to support in the $70‒90 region, so far bottoming at $75. In this article, I renew my call for a move up to the $360 region to finish off this circle-iii. We can eventually see a move to $1,400, as mentioned. However, this won’t occur without another major correction. Therefore, it’s wise to trade this chart one target at a time.
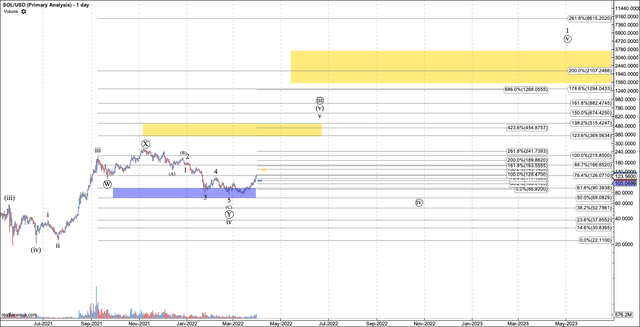
Motivewave software
Daily chart of Solana
Mina Protocol is a newcomer to my articles, but we’ve been watching it in the Crypto Waves service since late last year. I confess I have not made use of this blockchain, but it touts privacy and Web 3 functionality. Using Elliott Wave Theory, I don’t need intimate knowledge of a crypto’s functionality in order to make smart trades.
Mina has one of the prettiest “1-2 Setups” among the altcoins we’re following. This is our term for a wave 1 and 2 that sets up a nice third wave to come. MINA did come down very low in its wave 2 support. It bottomed at $1.57, and we would have trouble holding on to the bullish case below $1.47. So far we have a stick save.
Despite how close MINA got to turning bearish, it has presented a very nice five-wave reversal that may kick off the third wave that targets $41, nearly 20 times today’s price. Now, I’m going to warn again that the Bitcoin bull market is mature and MINA may never hit that target. However, the five-wave reversal we have does suggest that a roughly 100% or more move to between $5.50 and $7.45 is highly probable. We’ll trade for that level first and then watch for it to set up for the rest of the third wave.
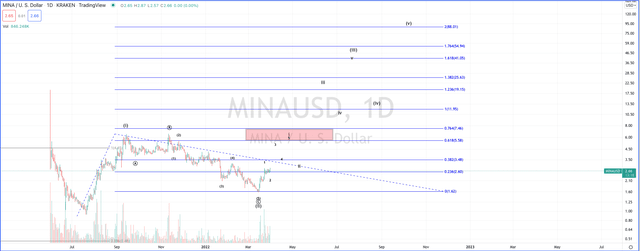
Tradingview.com
Daily chart of Mina Protocol
Conclusion
We understand that cryptocurrency investors have had a frustrating time, as Bitcoin has hugged recent lows and made little progress for the last 12 months. However, the wave four flat we’ve tracked is considered to be a breather in a larger bullish cycle. And while Bitcoin has put in a very uncertain reversal, many altcoins seem to have bottomed. Avalanche, Solana and Mina Protocol are three bullish altcoins we are watching and trading. You may want to consider them for your cryptocurrency portfolio.
