- Bitcoin prices are up 3% on the day and could rally toward the $25,000 barrier.
- Ethereum price is up 4% on the day and shows potential for a 30% rally.
- XRP price shows congestion near the current market value but could rise an additional 9%.
The crypto market is witnessing an influx of buying interest. Key levels have been marked to assess where the uptrend move may find its next resistance.
Bitcoin price ready to move higher
Bitcoin price currently auctions at $23,746. The 3% move to start the beginning of February is a positive gesture of gains to come. During January, the bulls established a swing high at $23,960. The ongoing uptrend move will likely take out the liquidity above the mentioned price level and conquer terrain within the $24,000 price zone.
Because the 8-day exponential moving average has catalyzed the recent surge, and the 21-day simple moving average has yet to be retested during January’s 40% hike, the Bitcoin uptrend seems poised to rally considerably. A conservative target would be the $25,000 price territory, resulting in a 7% increase in the current market value.
BTC/USDT 1-day chart
Invalidation of the uptrend thesis could occur from a breach below the recent swing point at $22,481. In doing so, the bears could produce further decline likely to target the psychological $20,000 level resulting in a 15% decrease from the current Bitcoin price.
Ethereum price more bullish than meets the eye
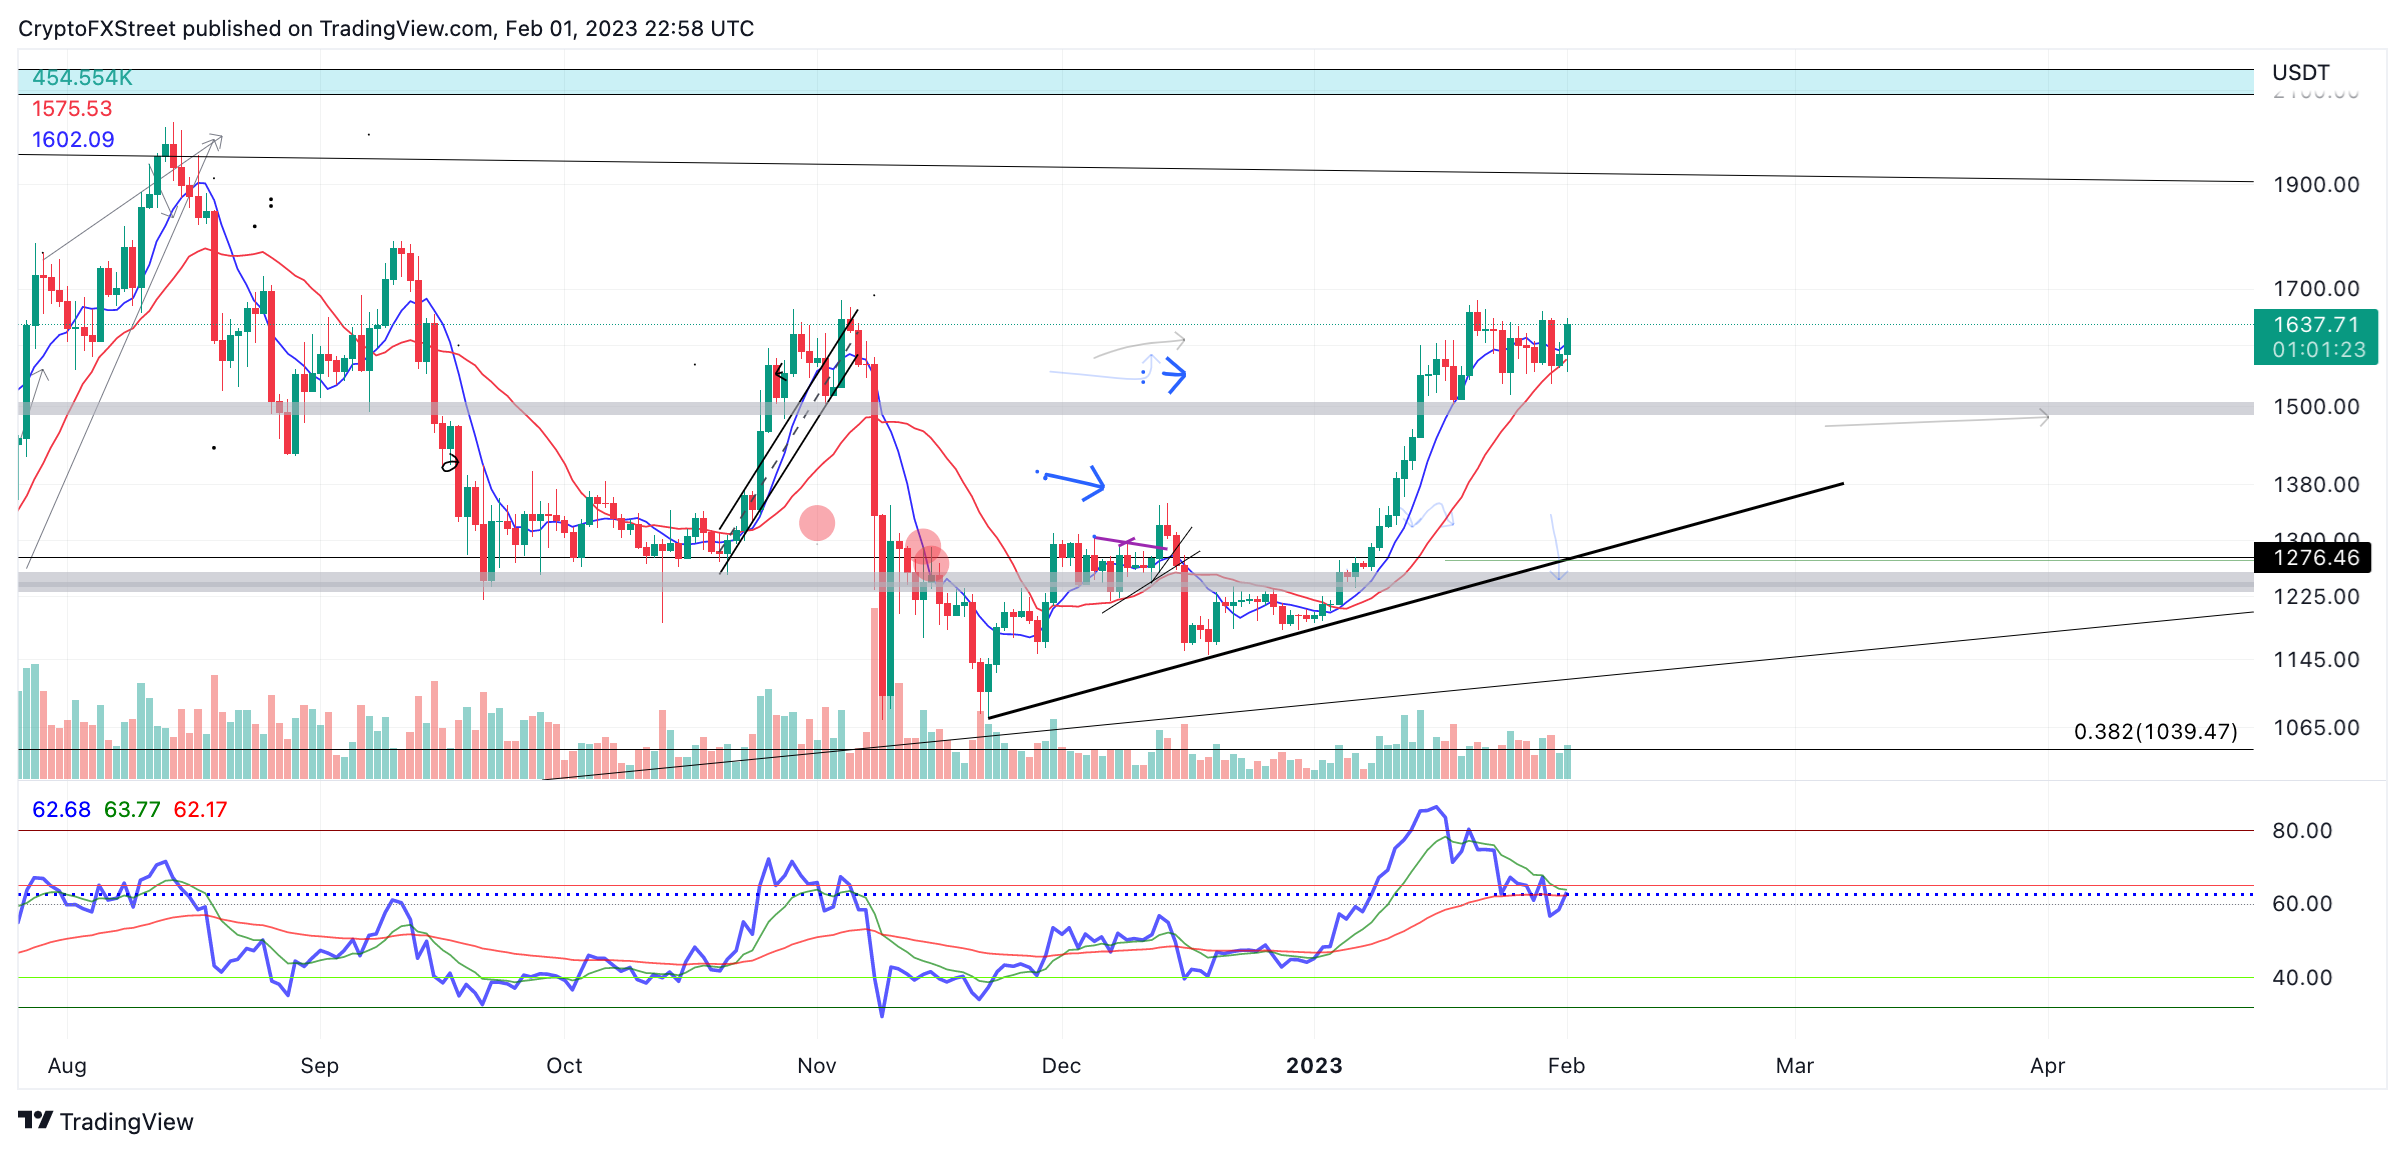
Ethereum price is showing cues of bullish strength that should not be taken lightly. At the time of writing, the decentralized smart contract token has risen by 4% on the day. When analyzing the thrust candle from the previous congestion zone near $1600, the candle’s technicals suggest that Ethereum is building strength in anticipation of a bullrun.
Ethereum price currently stands at $1644.50. The 21-day Simple Moving Average (SMA) is producing a bullish cross over the 8-day EMA, The last time these indicators crossed was on January 4 when Ethereum traded at $1211. This cross resulted in a 40% rally into January’s high at $1679.26.
Previous outlooks have mentioned a significant liquidity zone near the $2100 price level. A tag of the barrier would result in a 30% increase from the current Ethereum price today.
ETH/USDT 1-day chart
Invalidation of the uptrend idea could be placed under the recent swing low under the 21-day SMA at $1535.20. A breach of this barrier could lead to a steeper downtrend move targeting the halfway point of the 40% rally in January. The Ethereum price would decline towards the $1300 level or a 30% decrease as a result from the bearish scenario.
XRP price congested but could follow the trend
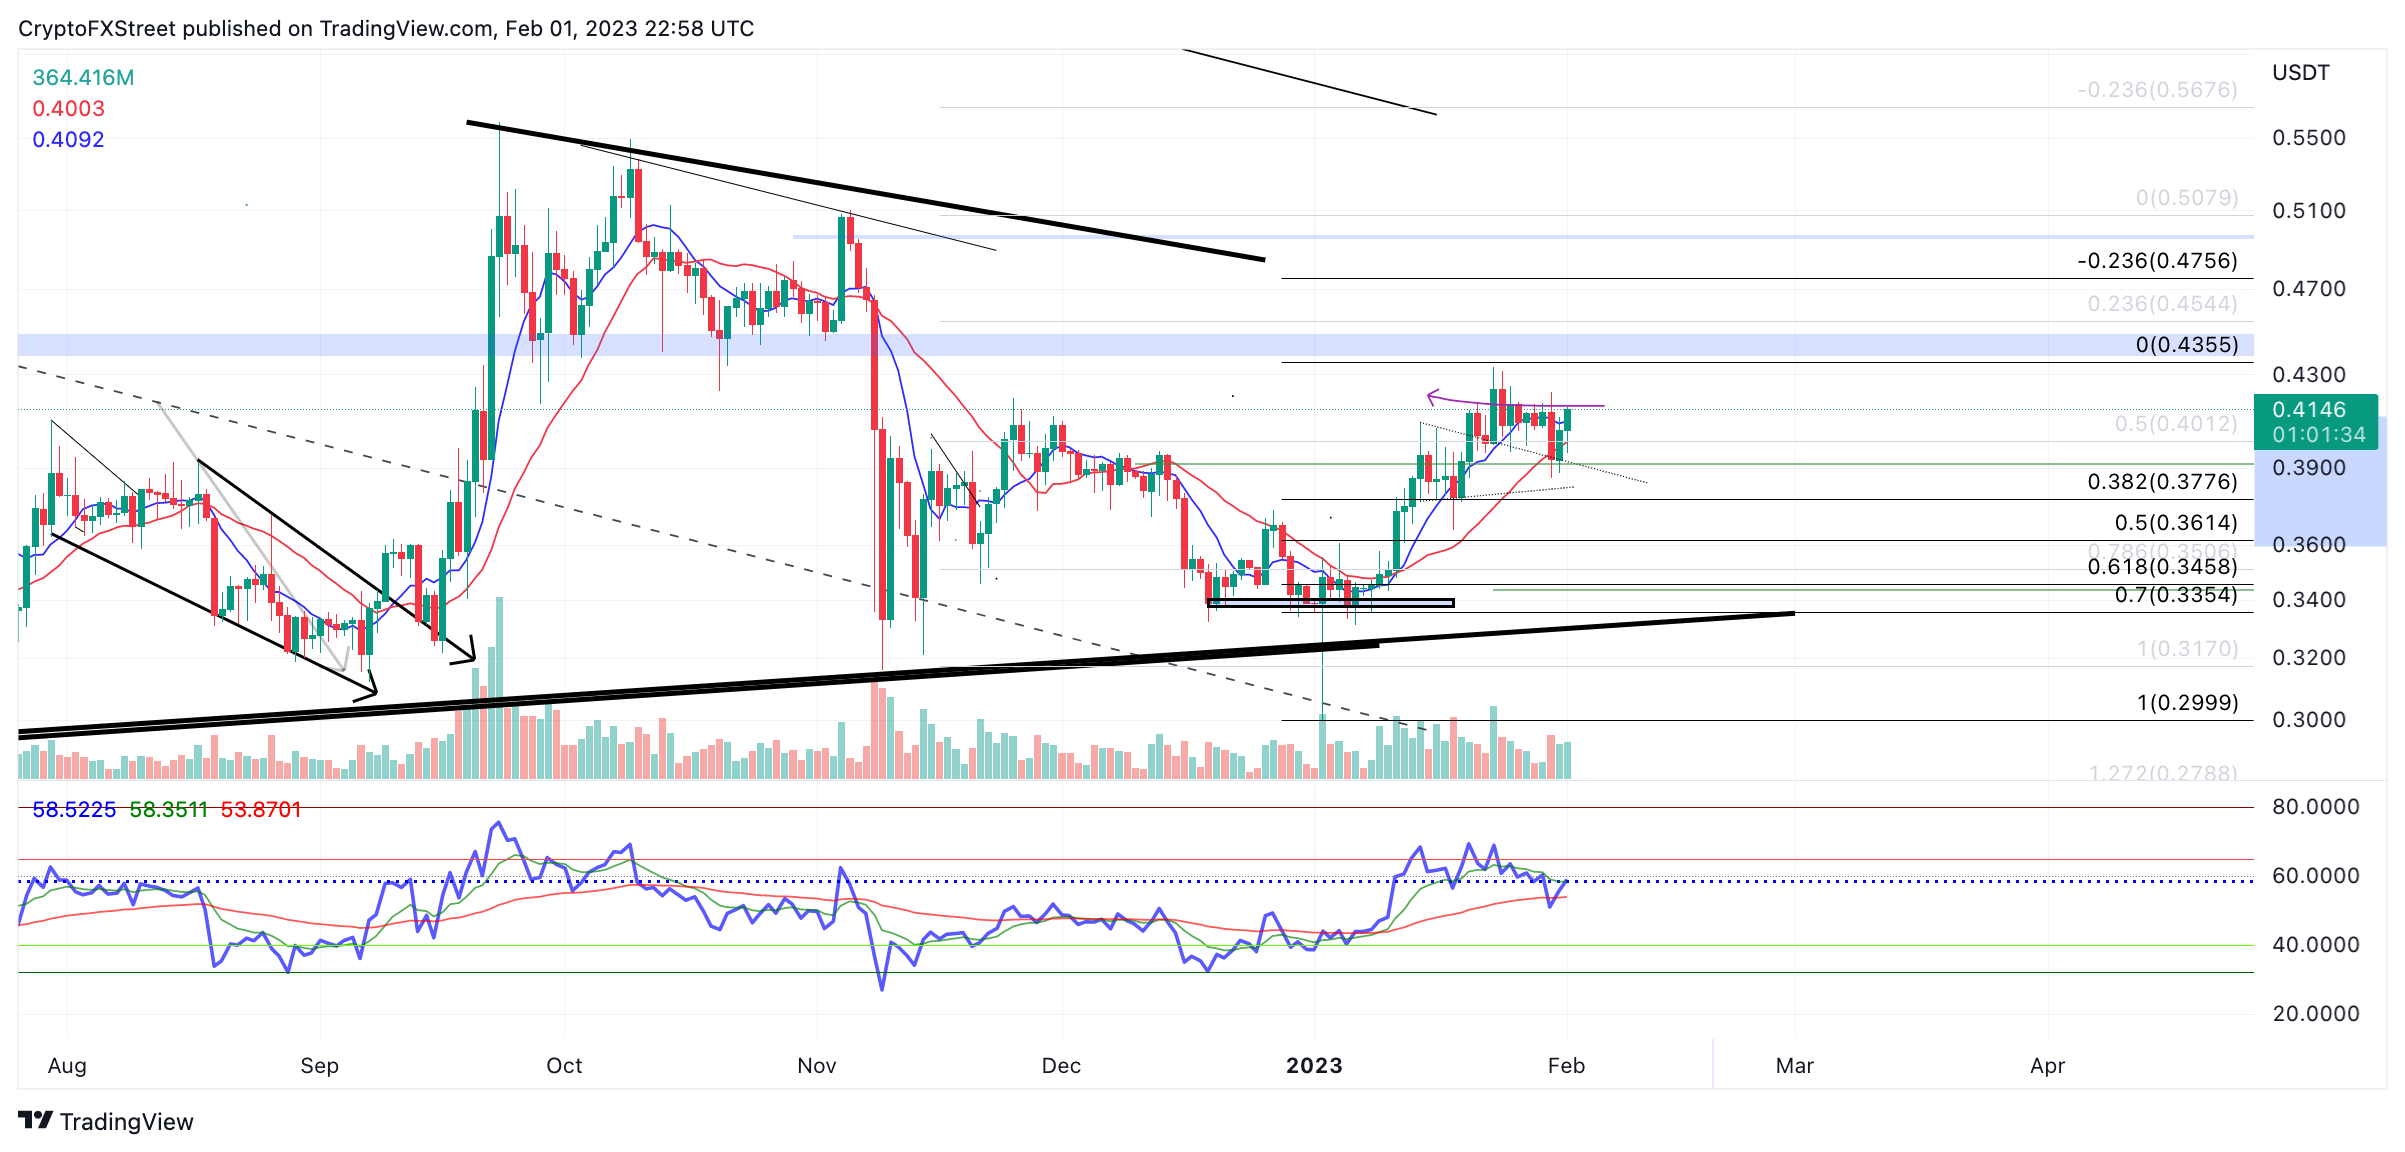
XRP price joined the bullish surge in the crypto ecosystem on February 1, up 4% on the day. The Ripple price has retraced back into the previous $0.41 congestion zone. Unlike Ethereum, however, XRP still has more bearish cues within its technicals.
For example, the bulls have yet to conquer the previous range high at $0.422, and there are hidden bearish divergence patterns noted on the relative strength index.
Still, if XRP continues to move in unison with Bitcoin and Ethereum, there is a chance for the bulls to challenge liquidity above the January high of $0.433. The next stop for the XRP price is the broken support near $0.44, creating the potential for a 9% rise from Ripple’s current market value.
XRP/USDT 1-day chart
Invalidation of the bullish thesis for XRP could occur from a breach below the recent pivot point at $0.385. A test of this barrier would likely result in more liquidations, with a key level of interest being the $0.35 liquidity zone or a 13% decrease from XRP’s current price.


