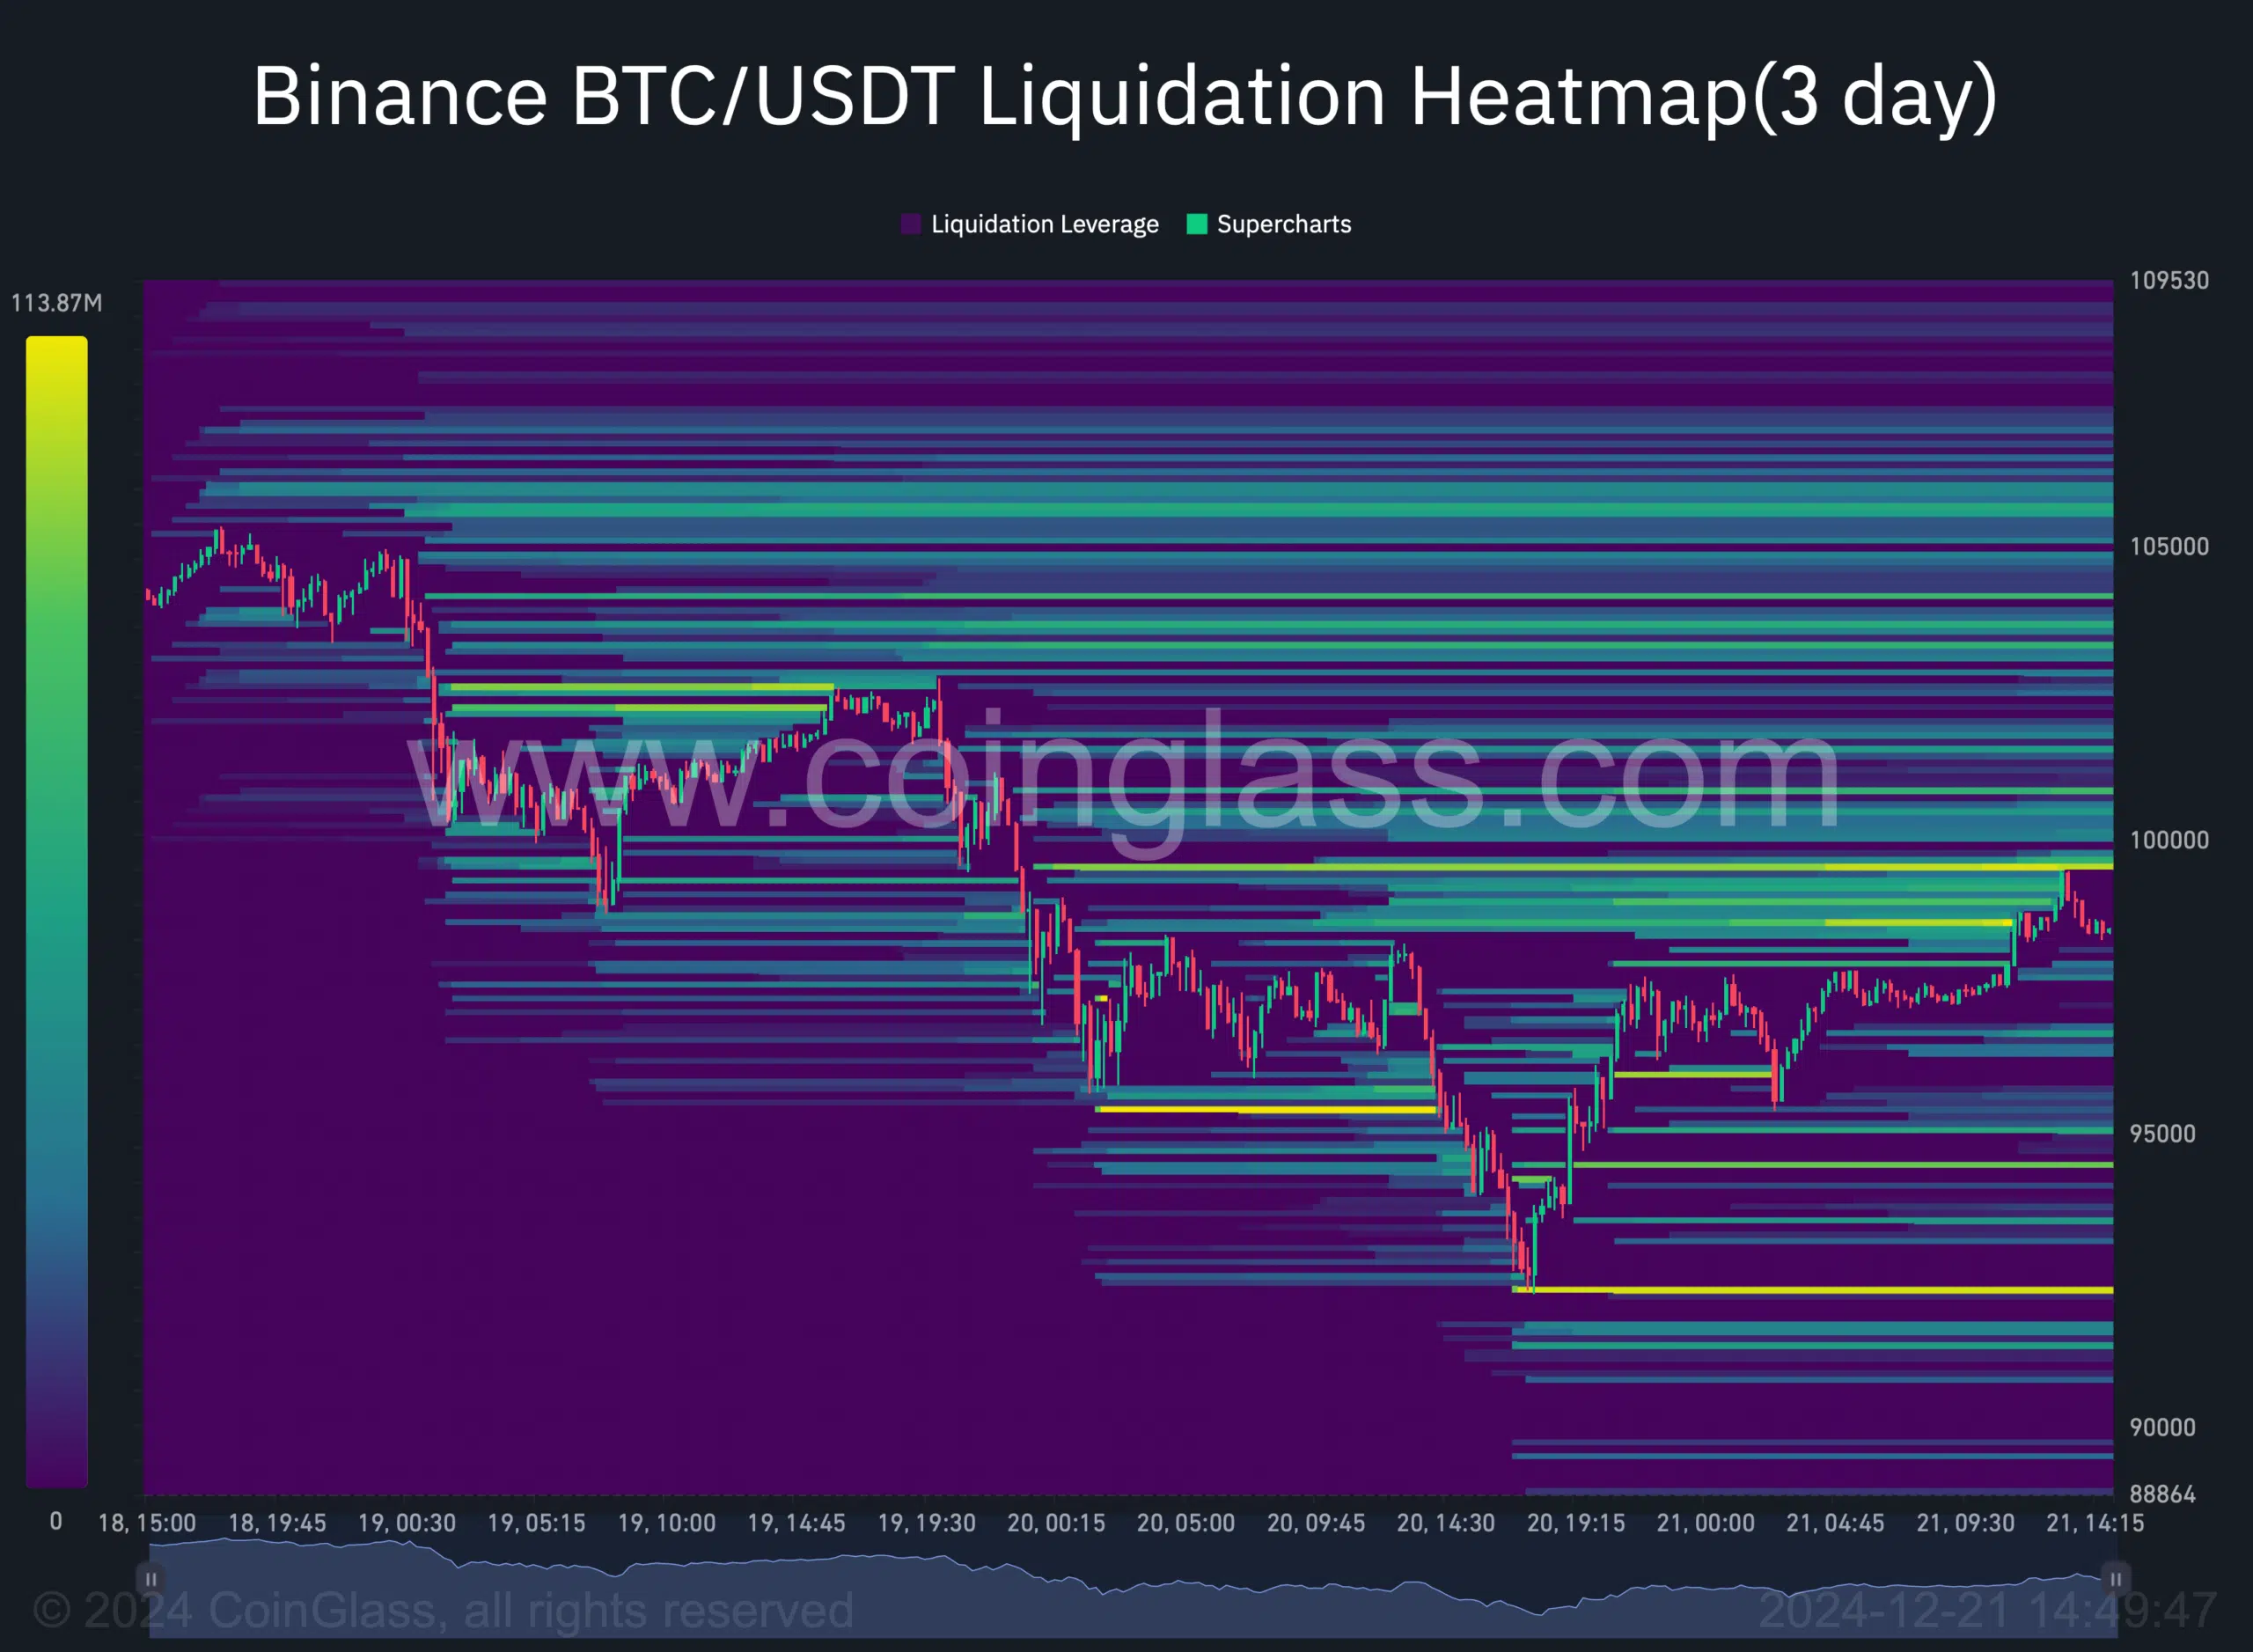
- Bitcoin’s liquidation heatmap highlighted a strong resistance level at $99k
- Market indicators and metrics were ambiguous about the buying/selling pressure
Bitcoin [BTC] has been struggling to push its price beyond $100k after a pullback from that level a few days ago. While this pullback took many by surprise, the latest on-chain data revealed a possible reason behind it.
So, does this mean investors have to wait longer to see the king coin cross that level again?
What’s going on with Bitcoin?
After a week-long decline, Bitcoin’s price managed a 3% price hike in the last 24 hours. However, this wasn’t enough to push it past the $100k-level.
Ali Martinez, a popular crypto analyst, shared a tweet pointing out a possible reason behind BTC’s restricted movement. According to the same, the cryptocurrency is facing a brick wall between $97,500 and $99,800, where 924,000 wallets previously purchased over 1.19 million BTC.
Martinez mentioned that if BTC can break above that level, then it won’t be too ambitious to expect the coin to reach a new all-time high. AMBCrypto’s analysis of Coinglass’ data also revealed a similar resistance zone near $99k. This was the case, as a significant amount of BTC will get liquidated at that level.
In the meantime, Alphractal, a data analytics platform, highlighted an anomaly between BTC’s price and its funding rate. The tweet mentioned that the aggregated funding rate reflects the balance between buyers and sellers in perpetual futures contracts.
When the funding rate rises significantly, it usually indicates a predominance of long positions – A sign of market optimism. However, recent trends indicated that Bitcoin began to fall, even though the funding rate remained positive.
“The price drop, despite the positive Funding Rate, suggests caution. A persistently high Funding Rate may expose the market to liquidations, while stabilization or reversal of the Funding Rate should be monitored to anticipate future moves.”
Will BTC consolidate more?
Now, to see whether the king coin may be heading, AMBCrypto checked its critical metrics. The coin’s exchange reserves continued to drop—A sign of rising buying pressure. This finding was further supported by Bitcoin’s buy volume.
The metric touched 100 on 19 December. For starters, a value closer to 100 indicates that buying activity is dominant in the market for a particular asset. In this particular case – BTC.
Read Bitcoin’s [BTC] Price Prediction 2024-25
On the contrary, the Chaikin Money Flow (CMF) had a different reading. The technical indicator registered a decline, which often means a drop in buying pressure.
If that’s true, then investors will have to wait longer to see BTC break the $99k resistance and climb above $100k again.


