- Solana’s golden cross and rising trading volumes highlighted strong bullish momentum
- Key support zones at $223 and $175 could offer fallback areas if SOL faces rejection at the $265 resistance level
Solana‘s (SOL) price recently climbed to $264, grabbing the market’s attention with its robust performance and bullish sentiment. Beyond the charts, however, this rally also reflected the network’s rapid growth and its evolving role in reshaping global finance.
Hence, it’s worth exploring the factors driving Solana’s momentum, from technical signals to ecosystem developments, while analyzing what’s next for SOL.
Technical indicators and growing optimism
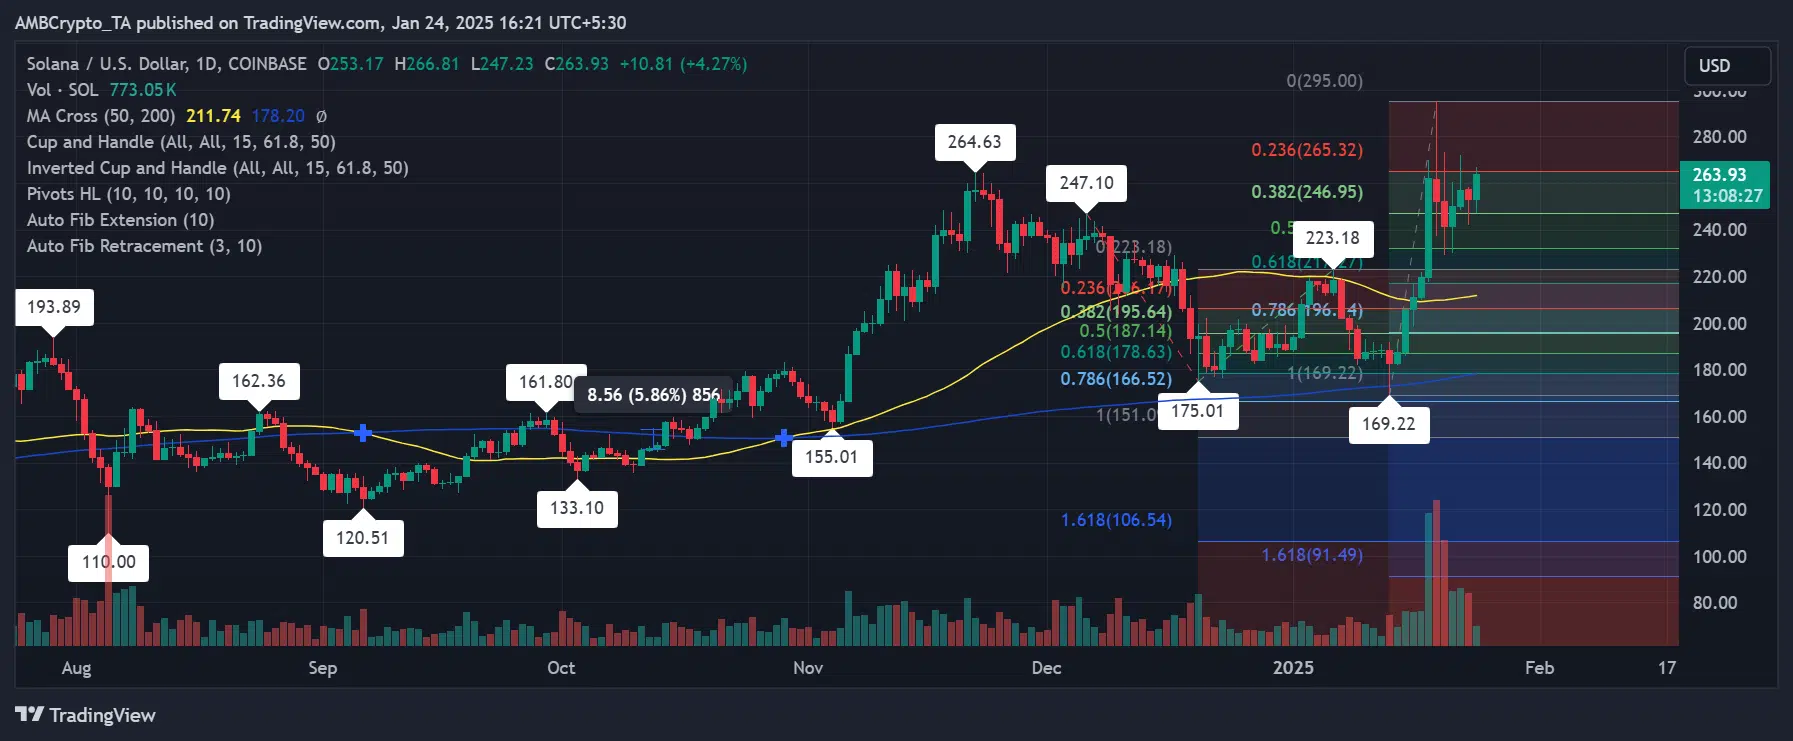
Strong technical indicators underpin Solana’s upward momentum. On the daily chart, SOL’s price was around $263.93 at press time, following a 4.27% hike over the past session. This rally brought the price closer to breaking the critical resistance level of $265.32, aligning with the 0.236 Fibonacci retracement zone.
Should this level break decisively, the next target will likely be $280 – A psychological milestone.
The 50-day moving average at $211.74, crossing above the 200-day moving average at $178.20, confirmed a golden cross – A classic bullish signal. This, coupled with a steady uptick in trading volume that had figures of 773.05k, hinted at growing market participation and confidence.
Why is SOL’s price gaining traction?
SOL’s latest price action can be attributed to key developments within its ecosystem. The launch of Solana-based memecoins such as $TRUMP has significantly boosted network activity. With $TRUMP reaching a market capitalization of $13.5 billion shortly after its debut, it’s clear how such projects can drive demand for SOL, the underlying token.
At the time of writing, the Solana memecoin market cap was as high as almost $23 billion.
Furthermore, market speculation surrounding the approval of Solana-focused exchange-traded funds (ETFs) has contributed to the bullish sentiment. Firms have filed applications for these ETFs, with decisions anticipated in March. The potential approval is seen as a validation of Solana’s value proposition, adding another layer of confidence among investors.
Solana’s vision – Internet Capital Markets
Solana’s rise is not just about its price. In fact, according to Multicoin Capital’s “The Solana Thesis,” the blockchain is poised to outperform traditional financial giants such as NASDAQ, Visa, and JPMorgan on key performance metrics like latency and cost efficiency.
Also, Solana’s near-zero transaction fees and scalability make it a compelling alternative for payments and decentralized finance (DeFi).
According to the thesis, innovations like Conditional Liquidity (CL) further strengthen Solana’s DeFi ecosystem. By allowing market makers to quote tighter spreads and reduce risks, CL enhances the trading experience for both retail and institutional participants. These advancements align with Solana’s broader goal of creating a global, permissionless financial system that empowers users worldwide.
Charting SOL’s price potential – Technical and sentiment analysis
From a technical perspective, several patterns underlined opportunities for sustained SOL price action. The cup and handle formation observed on Solana’s chart highlighted the potential for a breakout beyond $265, possibly hitting $295 if the momentum persists.
Meanwhile, support levels at $223.18 and $175.01 may act as safety nets, cushioning against any short-term corrections.
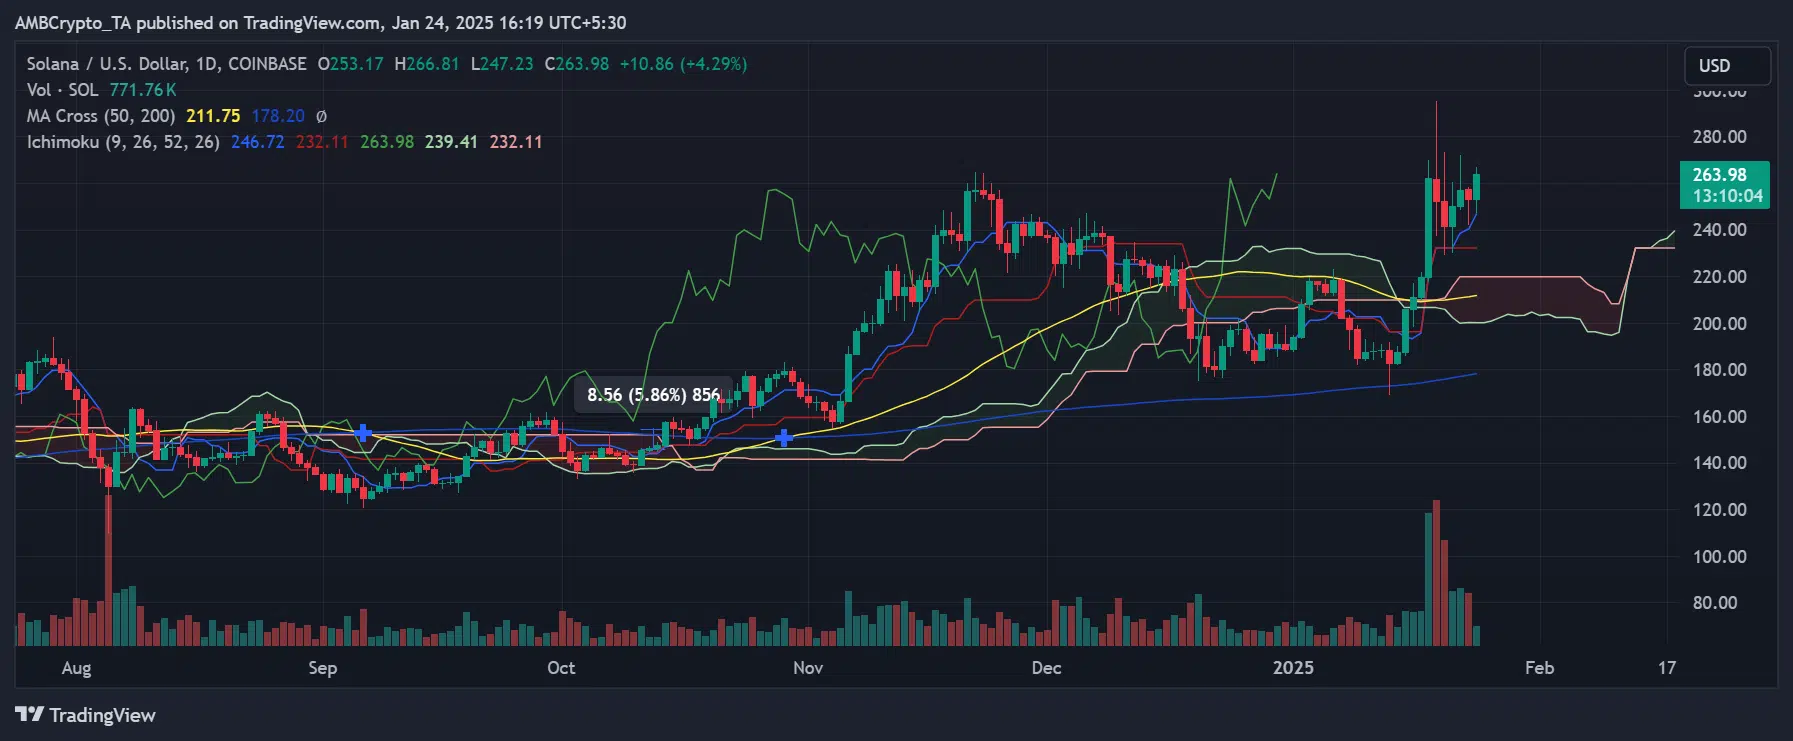
The Ichimoku Cloud setup reinforced the bullish outlook. At the time of writing, SOL’s price was above the cloud, supported by the Tenkan-sen at $263.98 and Kijun-sen at $239.41. These levels highlighted the network’s strength and growing investor confidence.
However, traders should monitor the baseline (Kijun-sen) for any signs of weakening momentum.
Bollinger Bands also revealed widening ranges, with the upper band at $275.82 and the lower band at $160.98. This implied heightened volatility, with consolidation likely if SOL fails to breach its $265 resistance.
Broader market context and future scenarios
Solana’s market activity reflects a broader trend of adoption and innovation. The network’s ability to support diverse financial instruments, from tokenized equities to real estate, expands its total addressable market (TAM). Additionally, Solana’s focus on maximizing extractable value (MEV) and its growing revenue streams underscore its long-term viability.
– Is your portfolio green? Check out the Solana Profit Calculator
If Solana’s price breaks above $265, a rally towards $280 or even $295 could materialize.
Conversely, a rejection at its press time levels might trigger a retest of $246 or lower support zones. Regardless of short-term fluctuations, the ecosystem’s underlying fundamentals remain strong, paving the way for sustained growth.


