Litecoin (LTC) price is approaching a crucial confluence of resistance levels at $108. If it breaks out, it will confirm its bullish trend reversal.
The Litecoin price has increased significantly in 2023. The upward movement could have occurred due to several positive Litecoin news, such as a partnership with Mastercard, creating the Litecoin Card program. Moreover, the price has often reacted similarly before halving events. During this upward movement, accounts holding between 100 and 10,000 LTC are accumulating.
Litecoin Approaches Crucial Level
The price history from the weekly time frame shows that the Litecoin price has fallen below a long-term descending resistance line since May 2021. The downward movement led to a low of $40.30 in June 2022. The price initiated a sharp upward trend that is still ongoing. So far, the highest price of the year has been $102.41.
However, the main test comes at the confluence of resistance levels at $108. A horizontal resistance level and the descending resistance line create this resistance. If the LTC price breaks out above it, it would confirm that it has begun a bullish reversal. This could take the LTC price to $150.
The weekly RSI supports this possibility since it is above 50, increasing, and has not generated any bearish divergence.
However, if a rejection occurs, the Litecoin price could fall back to the $72 horizontal support area.
Litecoin Price Wave Count Offers Two Possibilities
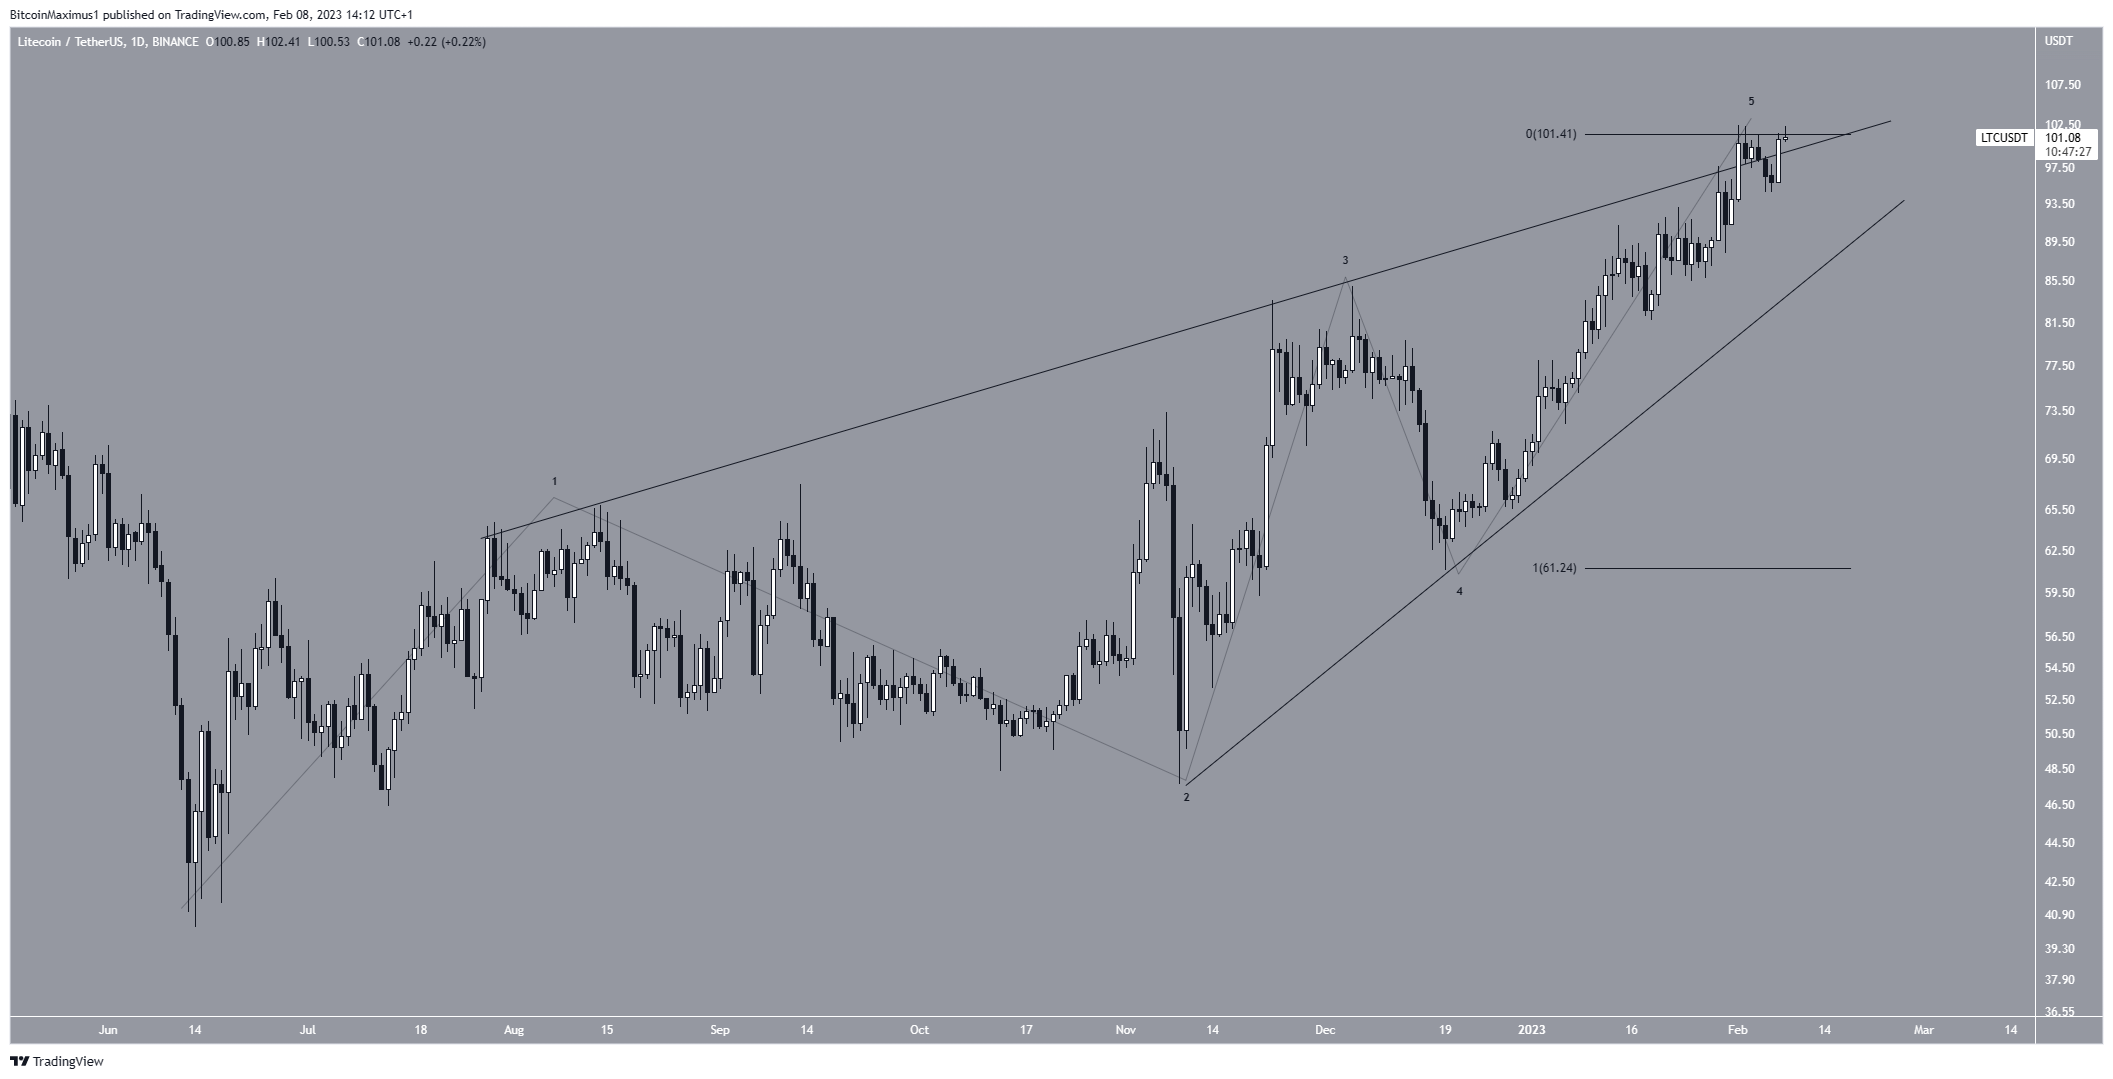
According to the wave count, there are two possibilities for the future movement. The first suggests that the Litecoin price is nearing the end of a leading diagonal.
Since wave three is the longest, waves one and five are likely to have a 1:1 ratio. If so, a top will be reached near the current level, possibly during the next 24 hours. The shape of the wedge and the alternation between waves two and four support this possibility. In this case, a correction toward the $72 area will occur for LTC.

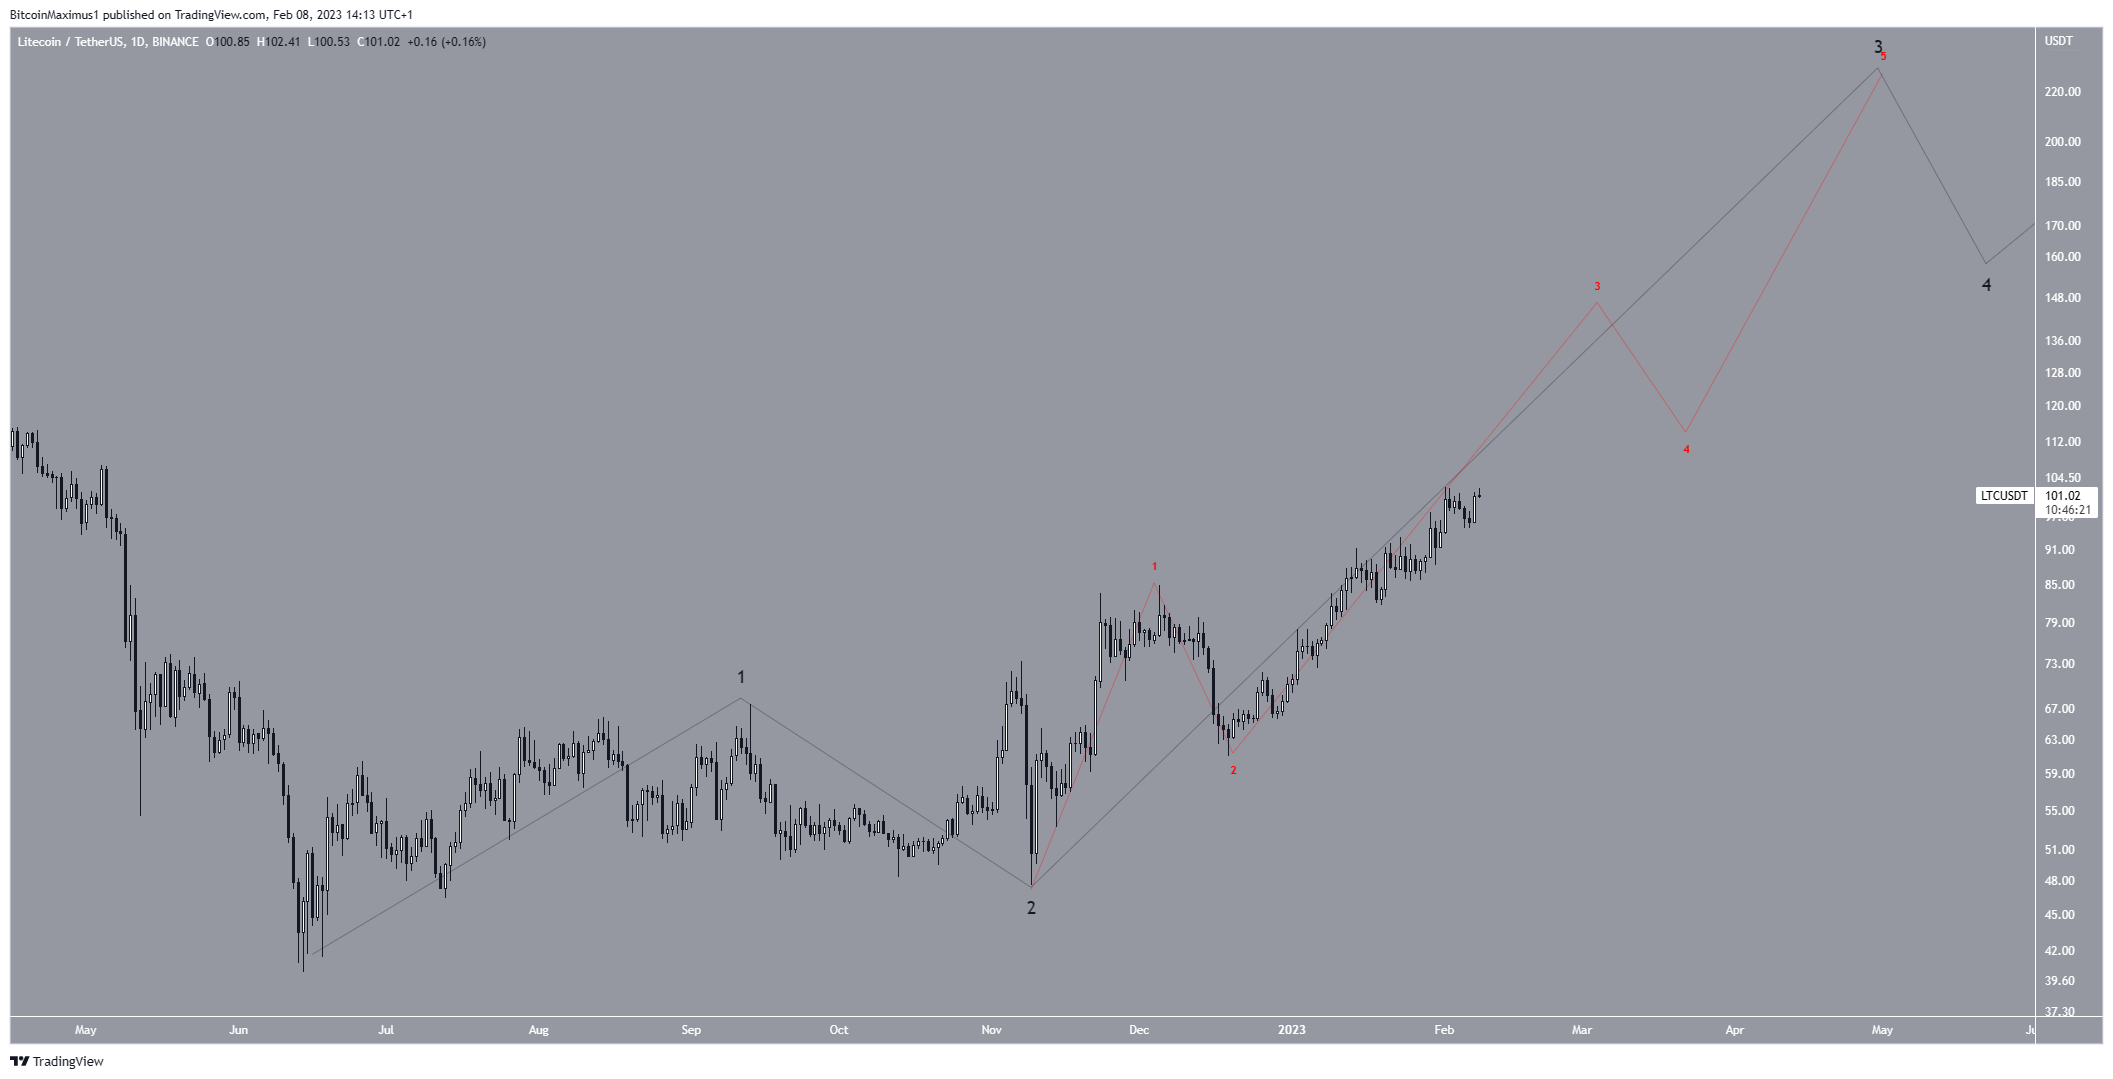
The second count is much more bullish. It suggests that the Litecoin price is in a 1-2/1-2 wave formation (black and red) and is currently in wave three. Since wave three is usually the longest and sharpest, the rate of increase would be expected to accelerate significantly very soon. If the count is correct, the LTC price will break out from the $108 area, move toward $150 and eventually go even higher.
Whether the Litecoin price breaks out from the $108 area or gets rejected can determine the correct count.

To conclude, the future Litecoin price movement is still unclear. Whether the price breaks out from or gets rejected by the $108 resistance area can be crucial in determining the future trend. In case of a breakout, the price could increase to $150. However, if it gets rejected, a drop to $73 is likely.
For BeInCrypto’s latest crypto market analysis, click here.
Disclaimer
BeInCrypto strives to provide accurate and up-to-date information, but it will not be responsible for any missing facts or inaccurate information. You comply and understand that you should use any of this information at your own risk. Cryptocurrencies are highly volatile financial assets, so research and make your own financial decisions.
