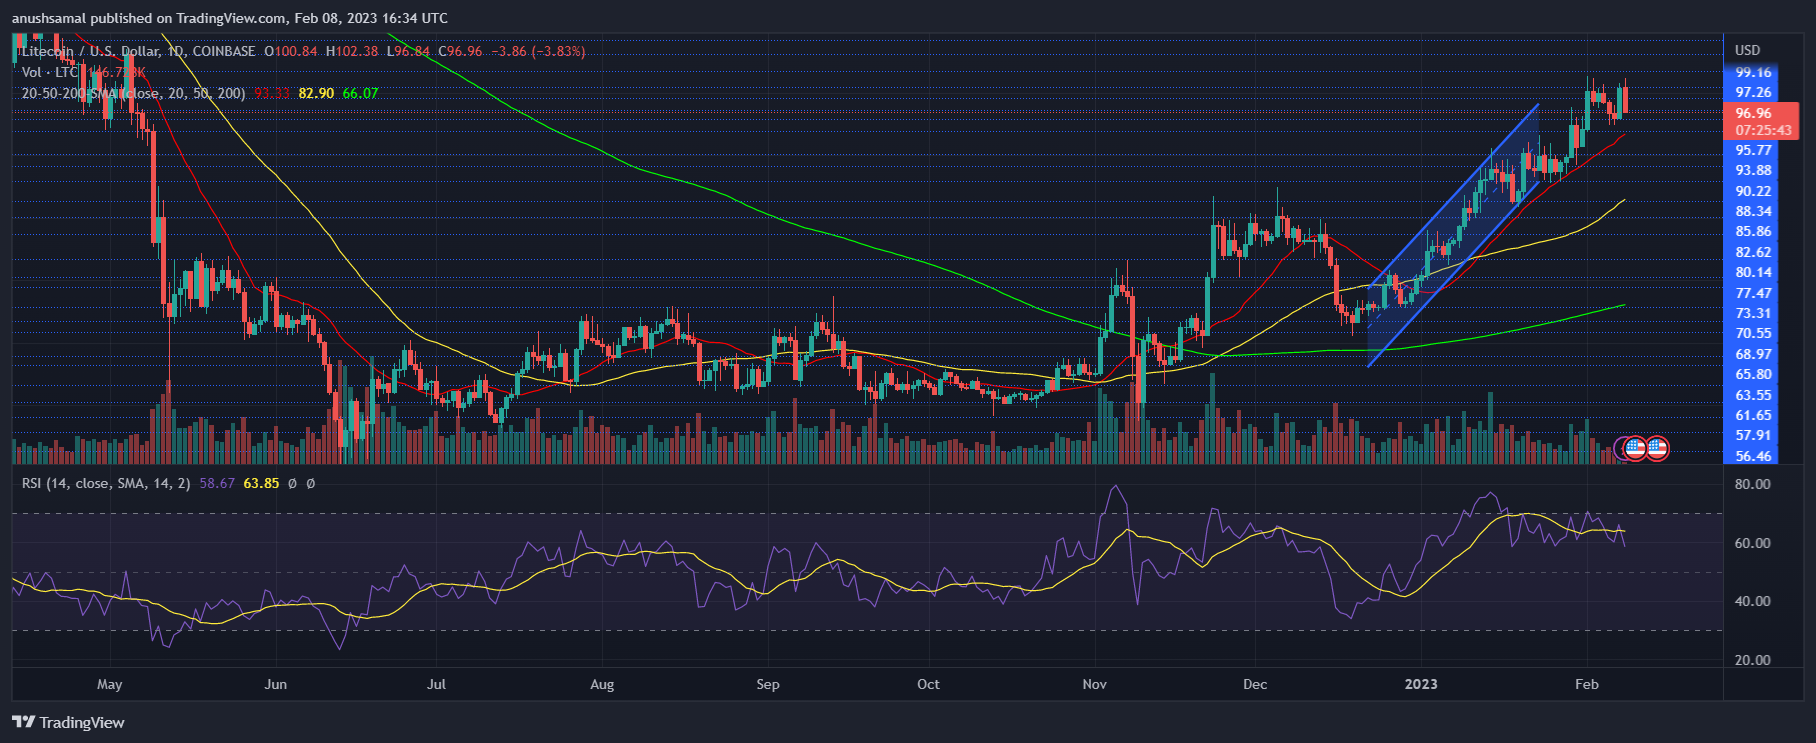
Litecoin price has been trading within an ascending trendline over the past couple of weeks; currently, the coin has broken out of the trendline but has maintained bullish momentum. Over the last 24 hours, LTC has depicted little price movement.
In the last week, the altcoin managed to appreciate over 4%, taking the price closer to its immediate resistance. The technical outlook for LTC sided with the bulls, despite bullish price action, although accumulation noted a slight downtick.
Despite a fall in demand, buyers still overpowered sellers at press time. LTC has managed to bounce back from the $95 price level, which has propelled the coin to move higher. It remains to be seen if the altcoin will break past a significant price barrier of $100.
A move above that level will cause LTC to rally further. Broader market strength remains crucial for Litecoin as a fall in demand can again bring the altcoin down to $95. It has to keep trading above its steady support line of $95. The market capitalization of Litecoin noted a decline, which suggested that there has been a dip in demand.
Litecoin Price Analysis: One-Day Chart
LTC was trading at $97 at the time of this writing. The altcoin has managed to move above the $95 resistance mark and has flipped that into its nearest support. As mentioned above, the altcoin’s current resistance stood at the psychological price mark of $100.
Even if LTC surpasses that level, the altcoin will face a barrier of $102. Breaking that barrier will enable the coin to attempt trading near the $107 price level.
If, on the other hand, the price begins to fall, the first support level is $95. Dropping from $95 will bring LTC down to $88. The amount of Litecoin traded in the last session was red, indicating a fall in buying strength.
Technical Analysis

As trading volume fell, indicators reflected a fall in buyers at press time. The Relative Strength Index was still vital and peaked just below the 60-mark, which indicated that bulls were still in charge of the altcoin.
On the same note, LTC moved above the 20-Simple Moving Average line as buyers were driving the price momentum in the market; a fall in demand, however, could push the coin below the 20-SMA line. Currently, LTC is also above the 50-SMA and 200-SMA lines, which also indicates bullishness.

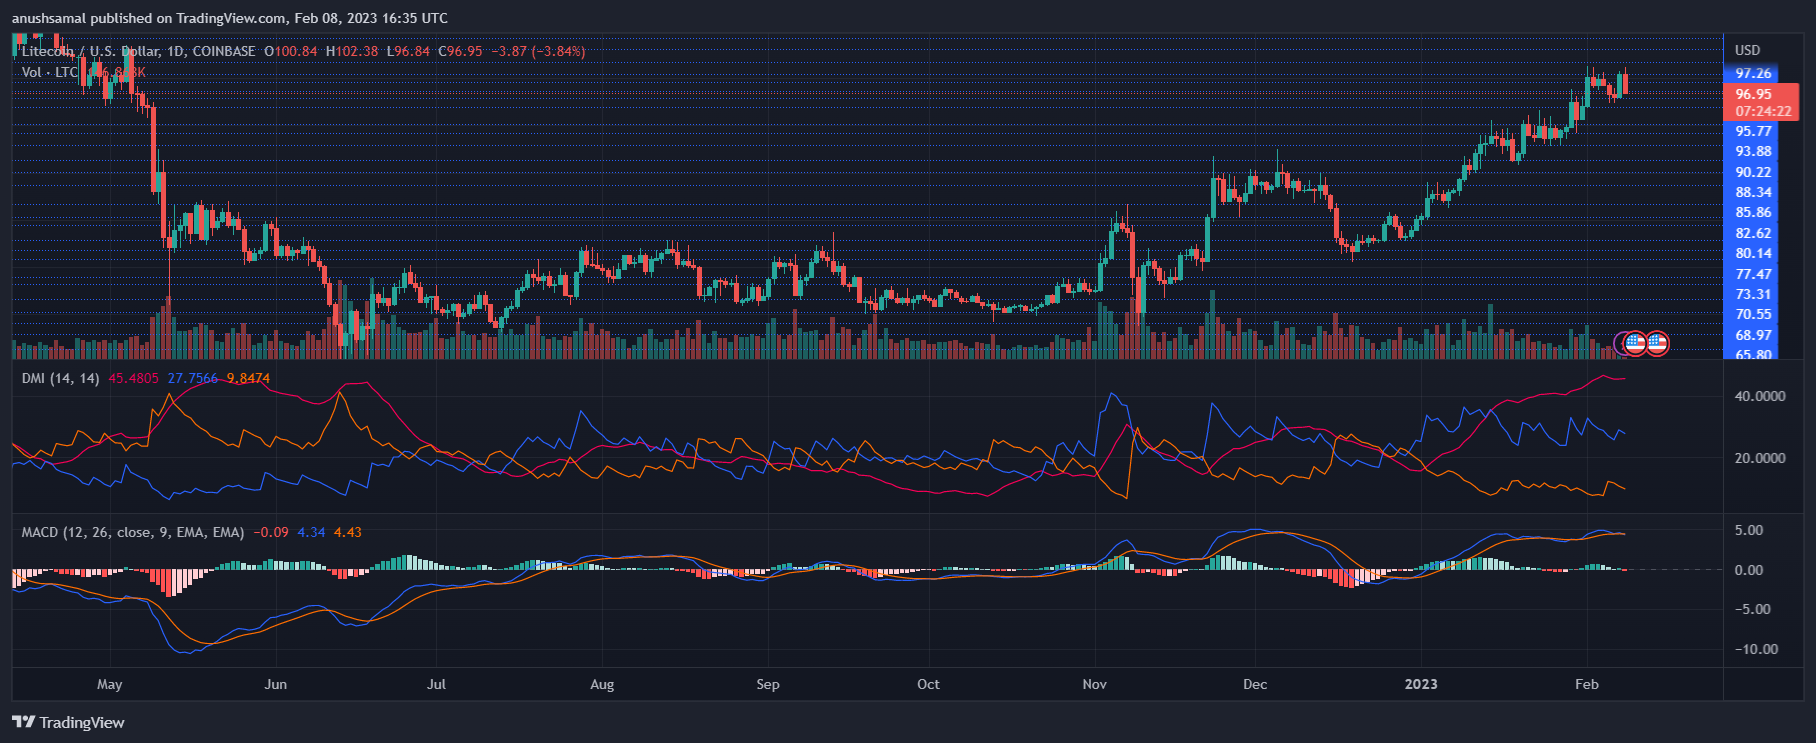
The Moving Average Convergence Divergence indicates the price momentum and reversals in the same. The indicator formed red signal bars tied to sell signals for LTC. Other indicators also reacted to the fall in demand over the past few trading sessions.
The Directional Movement Index was still positive, which meant bullish price action drove the movement of LTC, and the +DI line (blue) was above the -DI line (orange).
The Average Directional Index (red) moved above 40; this implies a strong price trend and reflects the idea of LTC aiming for $107.
Featured Image From UnSplash, Charts From TradingView.com
